Concept 16: Law of Supply
Learn
Beginner
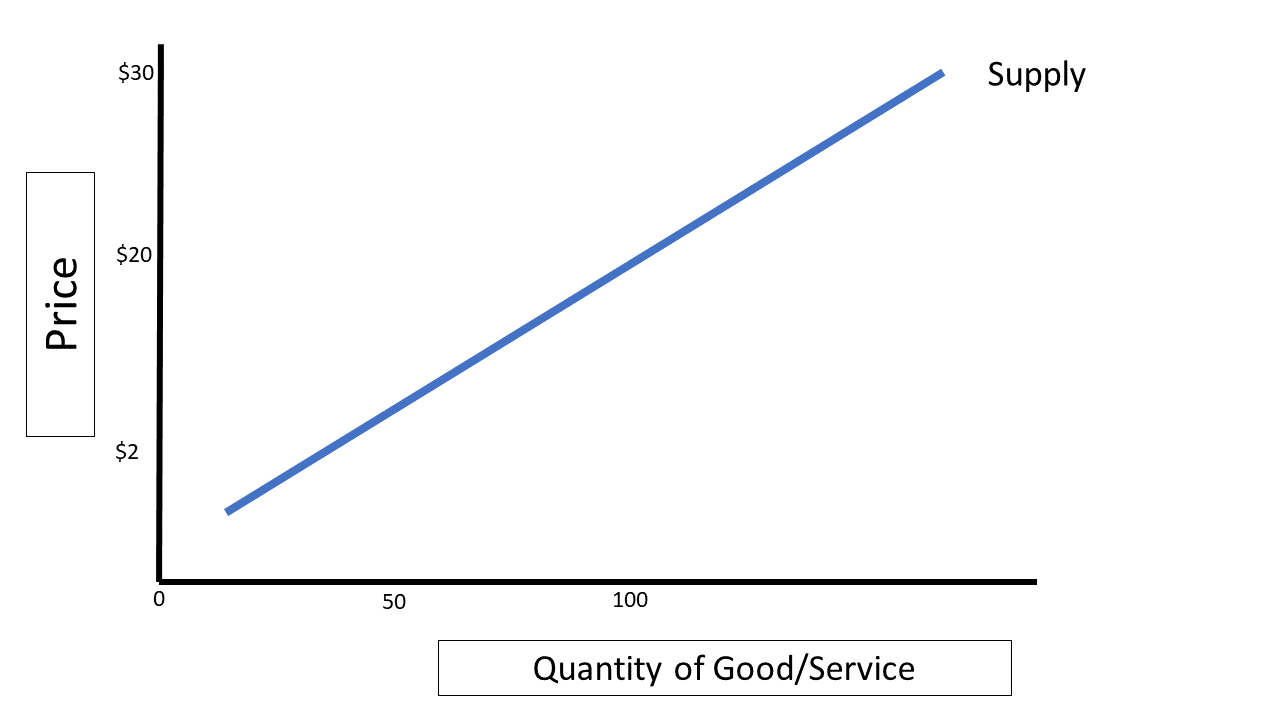
The Law of Supply states that there is a direct relationship between the market price of a good or service and the quantity of that good or service that producers are willing and able to produce. In other words, as the price of an item increases, producers want to supply more of it (to increase their revenue and profits) and vice versa. The law of supply explains how producers usually respond to price changes. Remember – quantity responds to price, not the other way around! When graphed, the law of supply is shown by an upward sloping supply curve like the one seen in Graph 16-1.
Intermediate

In general, higher prices mean higher profits. Let’s assume, for the moment, that all of the producer’s costs (ingredients, oven, time, etc.) are fixed, and to make 100 cookies costs her $50, or 50 cents per cookie. If she takes her cookies to a local market and sells each cookie for 75 cents, she makes $75 and is likely encouraged to make cookies again. If she finds out, however, that she can actually sell her cookies at this market for $2 each, she will be even more interested in making cookies because her profits will be higher. She will likely bring more cookies to market next time.
It is useful to remember that the law of supply operates on possible or hypothetical prices. If you could sell cookies for $25 each, cookie producers would see high profit margins and make lots of cookies. This would also likely cause more sellers to enter the cookie market. Sellers cannot set prices wherever they want, however, because they are bound by demand in the market. It is also true that in the real world, some costs are variable, so producing more cookies increases the total cost. The law of supply, therefore, is only useful in explaining what could be sold at various prices.
Advanced
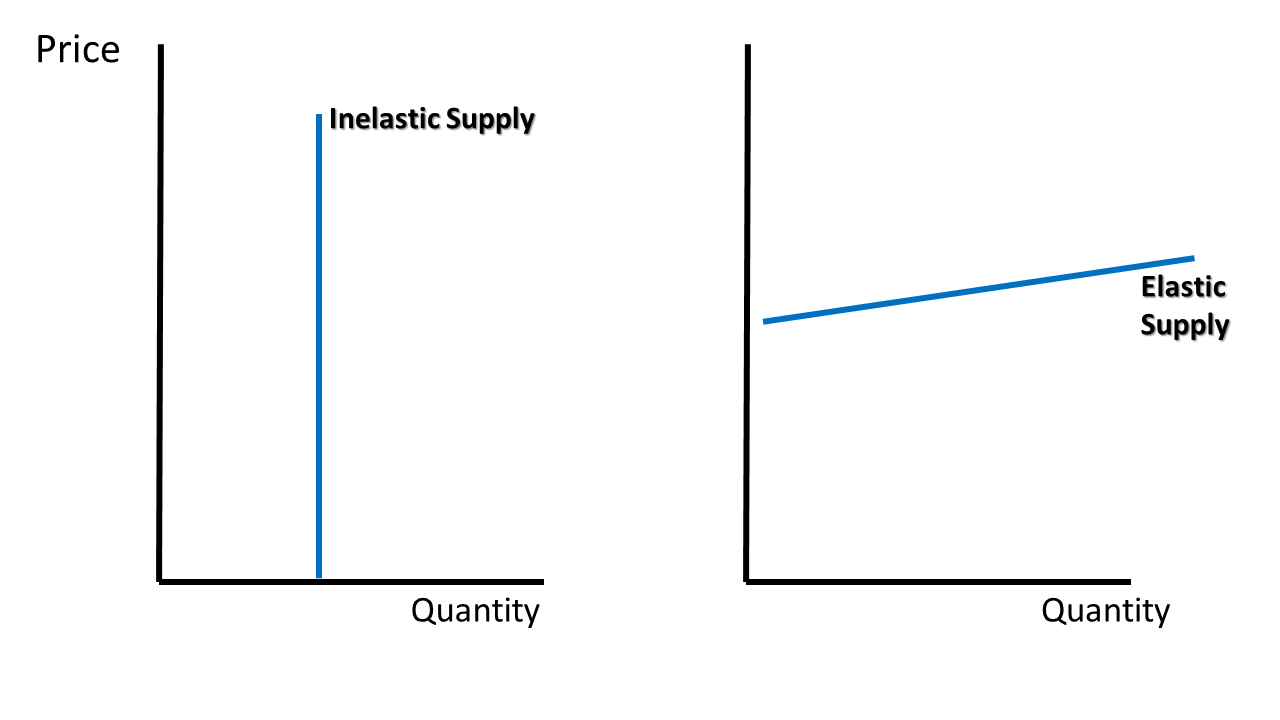
The law of supply does not always hold true. At some point, all of the resources required to produce the good or service in question will be used, and no more will be available. At this point, the supply curve will turn completely vertical, as production is maxed out. This is referred to as inelastic supply. Think of seats in a movie theater, for example. There are a maximum number of seats available for a given showing. No matter how much people are willing to pay, the number of seats in that theater do not change, at least in the short run. Alternatively, the supply curve is horizontal at the price it takes to make one unit of the product. In the example above, if cookies were only selling for 49 cents, you would expect the produce to stop producing them because it costs 50 cents to make one cookie. This is referred to as elastic supply. See Graph 16-2 for an example of what these look like.
Click a reading level below or scroll down to practice this concept.
Practice
Assess
Below are five questions about this concept. Choose the one best answer for each question and be sure to read the feedback given. Click “next question” to move on when ready.
Social Studies 2024
Define the law of supply and the law of demand.