Concept 18: Supply Shifts
Learn
Beginner

As described in Concept 16: Law of Supply, there is a direct relationship between the market price of a good or service and the quantity of that good or service that producers are willing and able to produce. Price is not the only variable that affects the decisions of producers, however. Non-price determinants, also called supply shifters, are variables that affect output at all possible prices. There are at least five important supply determinants. They are listed below along with general rules about how they affect supply:
- Cost of productive resources: cheaper resources increase supply; more expensive resources reduce supply
- Government regulations including taxes: more regulations decrease supply; fewer regulations increase supply (the opposite is true of government subsidies)
- Number of sellers: more sellers increase supply; fewer sellers decrease supply
- Producer expectations: expectations of higher prices decreases current supply, expectations of lower prices increases current supply
- Changes in technology or training: increases in technology/training increases supply, decreases in technology/training decrease supply
Intermediate
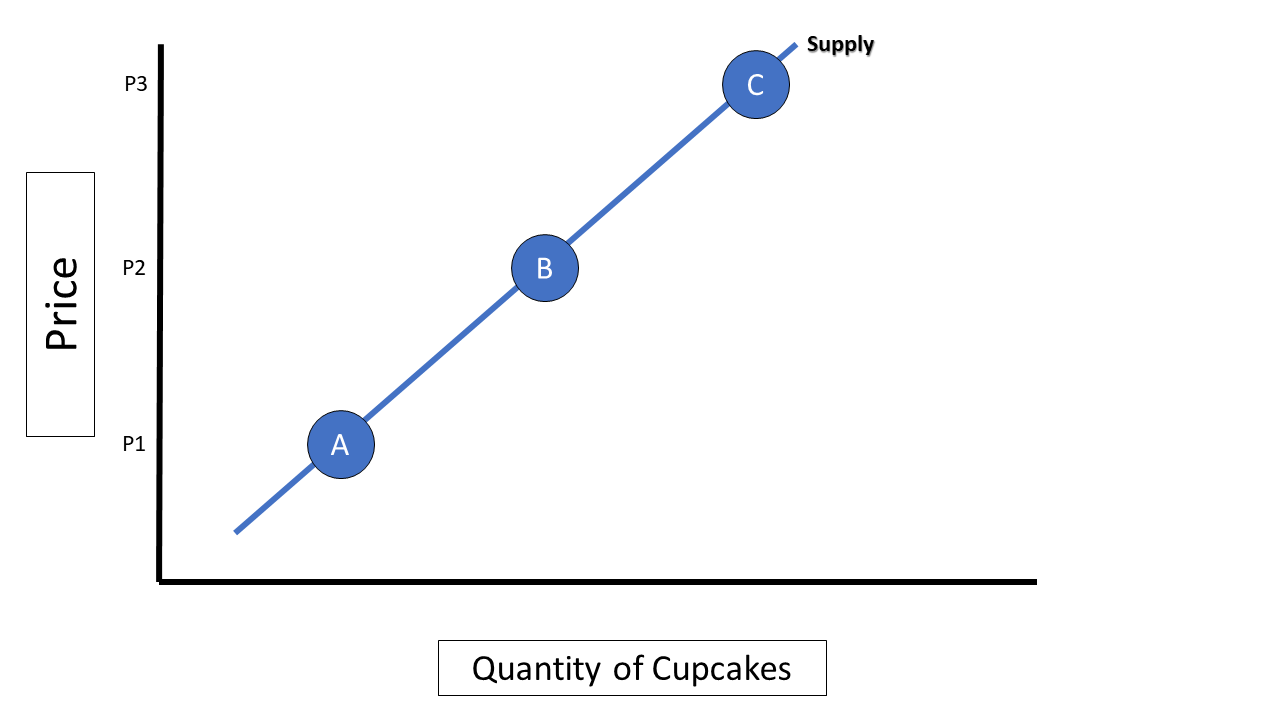
To understand how non-price determinants affect a supply curve, it is helpful to think of the curve as a series of points with a quantity supplied at low prices, medium prices and high prices. For example, let’s consider the market for cupcakes. There are some cupcake bakers that can produce cupcakes extremely cheaply and can sell at low prices; other bakers who only produce cupcakes that sell at medium prices; and others (like special boutiques) that only sell cupcakes because they can command very high prices. These prices and quantities are represented by points A, B, and C on graph 18-1.
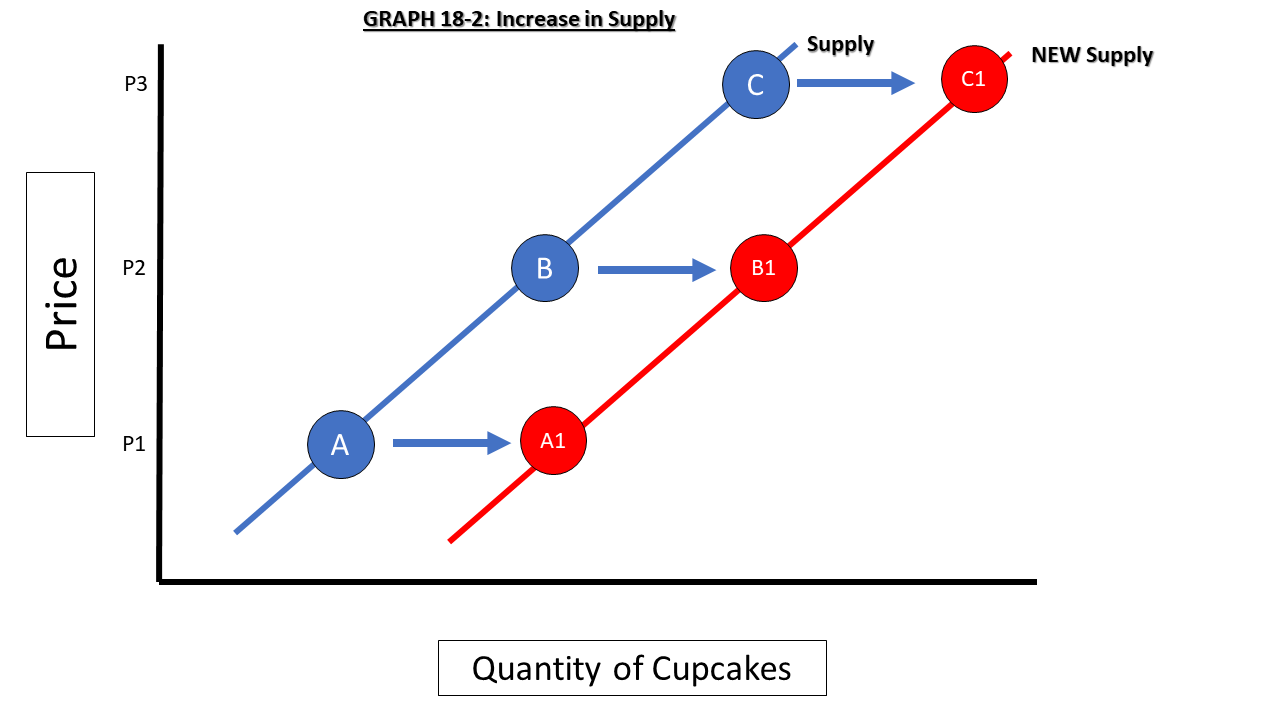
Let’s assume that, with no other changes in the market, the prices of flour, sugar, and eggs all drop significantly. Now, the cost to produce a cupcake has decreased. If the market prices remain the same, each tier of cupcake producer can now earn more profit on their cupcakes at the same prices, so they have an incentive to produce more at the same price! This has the effect of shifting each point on the line to the right, as seen on graph 18-2. This is referred to as an increase in supply. Increases in supply are shown by shifting the entire line to the right. Each price corresponds to a higher quantity.
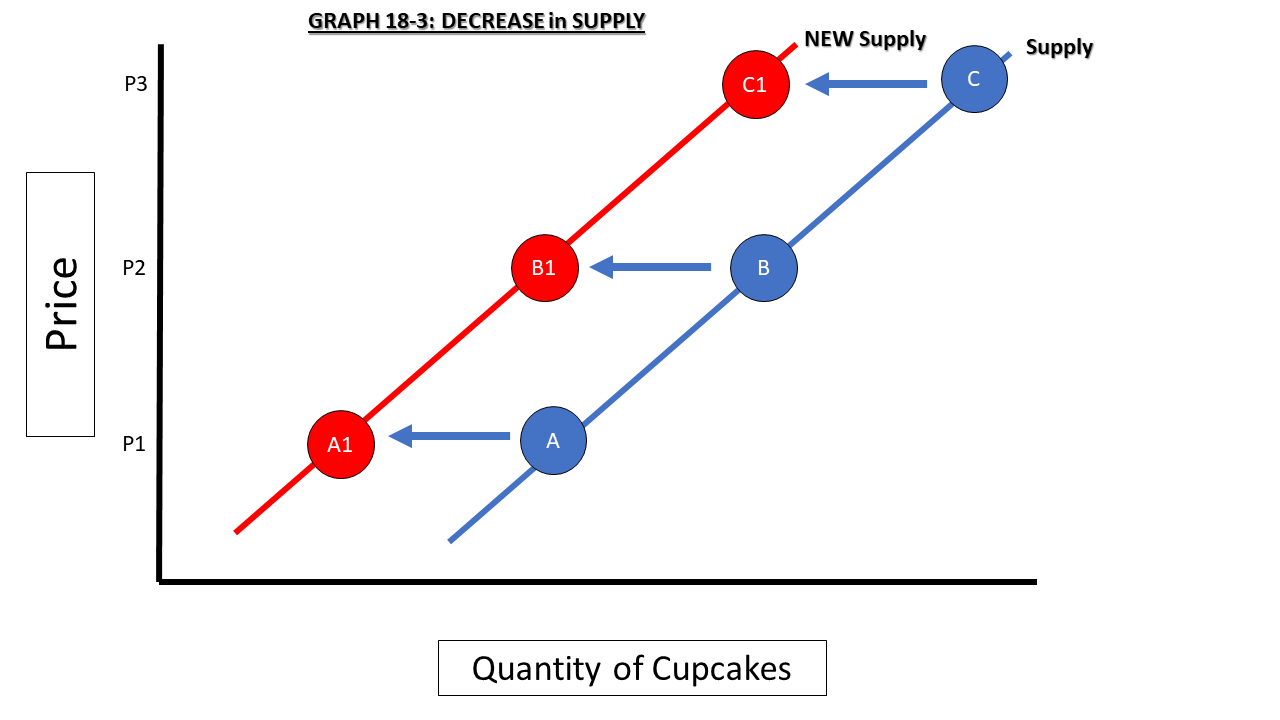
A decrease in supply works in a similar fashion. Assume, with no other changes in the market, that a new regulation is passed that says before any new cupcakes can be sold to the public, five dozen cupcakes must be sent to a local “cupcake tasting facility” and receive approval. Well, not only does this take time, it also increases production costs for ALL cupcake producers. Some cupcake producers will cut back on producing new cupcakes; others will possibly look for other alternatives (like whole cakes), and some producers will stop producing cupcakes altogether. At all possible prices the quantity of cupcakes will shift left as seen in graph two. Decreases in supply are shown by shifting the entire supply line to the left as seen on graph 18-3.
In summary, use the acronym IRDL (pronounced er-dul) – Increase Right, Decrease Left – to help you remember which direction the supply line should shift. Always use right and left instead of up and down!
Advanced

In the intermediate section, you may have noticed we repeated the phrase “no other changes in the market” when explaining supply shifts. Essentially, we are freezing movement in the market. This important concept is referred to as ceteris paribus in economics, a Latin phrase that basically means “all things being equal.” It is used as a way to focus on one variable at a time. Think of it as removing the “what ifs” from a scenario. In order to see the effect of the change in resource prices in the cupcake market, we will assume that everything else in the market – the number of buyers and sellers, the taste of the cupcakes, store hours, income of the buyers, etc. is all exactly the same, and the ONLY change in the market is the price of the resources. That way we can focus on just that single change rather than trying to model multiple changes at once that may have conflicting influences on supply. Economic models are simplified representations of extremely complicated real-life behaviors and decision-making. Ceteris paribus is an extremely important concept in advanced economic analysis because it helps isolate variables.
Click a reading level below or scroll down to practice this concept.
Practice
Assess
Below are five questions about this concept. Choose the one best answer for each question and be sure to read the feedback given. Click “next question” to move on when ready.
Social Studies 2024
Describe various determinants (shifters) of supply and demand and illustrate on a graph how they can change equilibrium price and quantity.