Concept 19: Demand Shifts
Learn
Beginner

As described in Concept 17: Law of Demand there is an inverse relationship between the market price of a good or service and the quantity of that good or service that consumers are willing and able to buy. When the price of a good rises, consumers are less willing and able to buy as much and vice versa. Price is not the only variable that affects the decisions of consumers, however. Non-price determinants, also called demand shifters, are variables that affect consumers at all possible prices. There are at least five important demand determinants. They are listed below along with general rules about how they affect demand:
- Related Goods: related goods come in two categories: complements (products that are used together, like hot dogs and hot dog buns) and substitutes (products that are used instead of each other, like name brand cereal vs. generic cereal)
- cheaper complementary goods increase demand; more expensive complementary goods decrease demand
- cheaper substitutes decrease demand; more expensive substitutes increase demand
- Income: more income increases demand for most normal goods, less income decreases demand
- Preferences/Tastes: greater preference for an item (like a fad or trend) increases demand; less preference decreases demand
- Number of buyers: more buyers increases demand; fewer buyers decreases demand
- Consumer expectations: expectations of future higher prices increases current demand; expectations of lower future prices decreases current demand
Intermediate
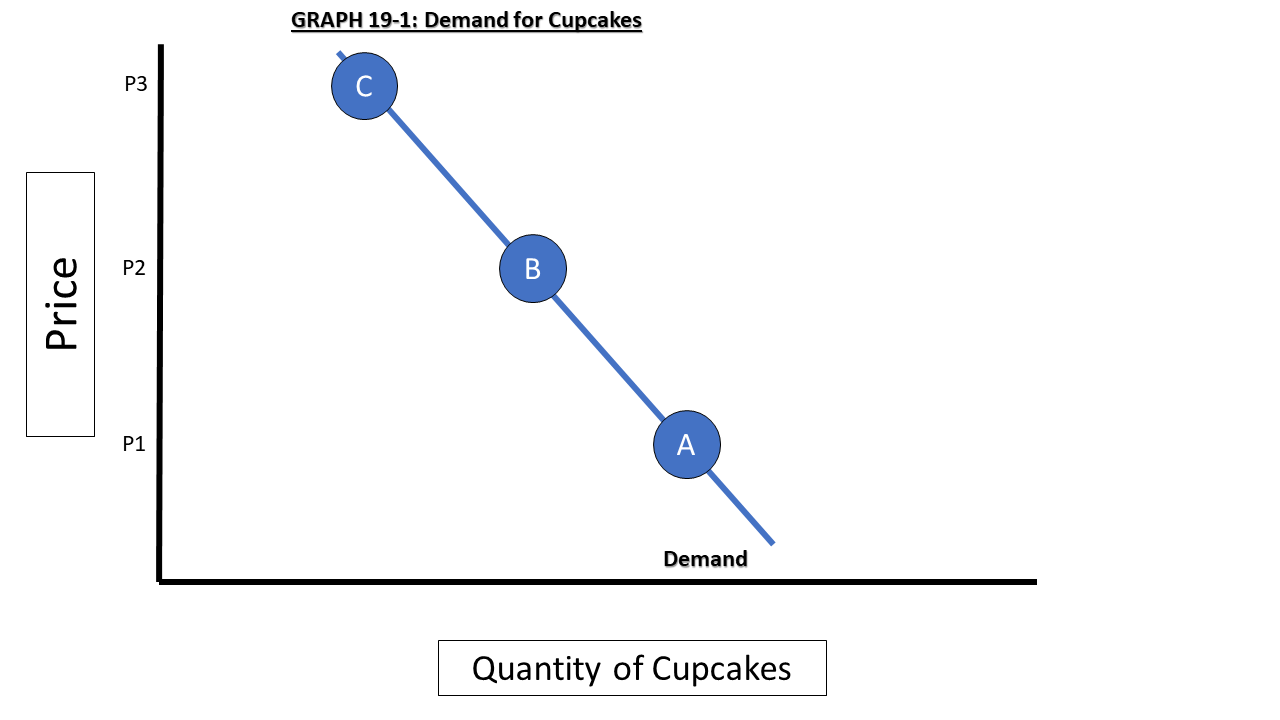
To understand how non-price determinants affect a demand curve, it is helpful to think of the curve as a series of points with a quantity demanded at low prices, medium prices and high prices. Let’s again consider the market for cupcakes. There are a lot of cupcake consumers who will buy cupcakes when they are sold at low prices. Consumers are less willing and able to buy at medium prices, and at very high prices, only a few consumers will purchase cupcakes for special events or as part of a vacation or something similar. These prices and quantities are represented by points A, B and C on Graph 19-1.
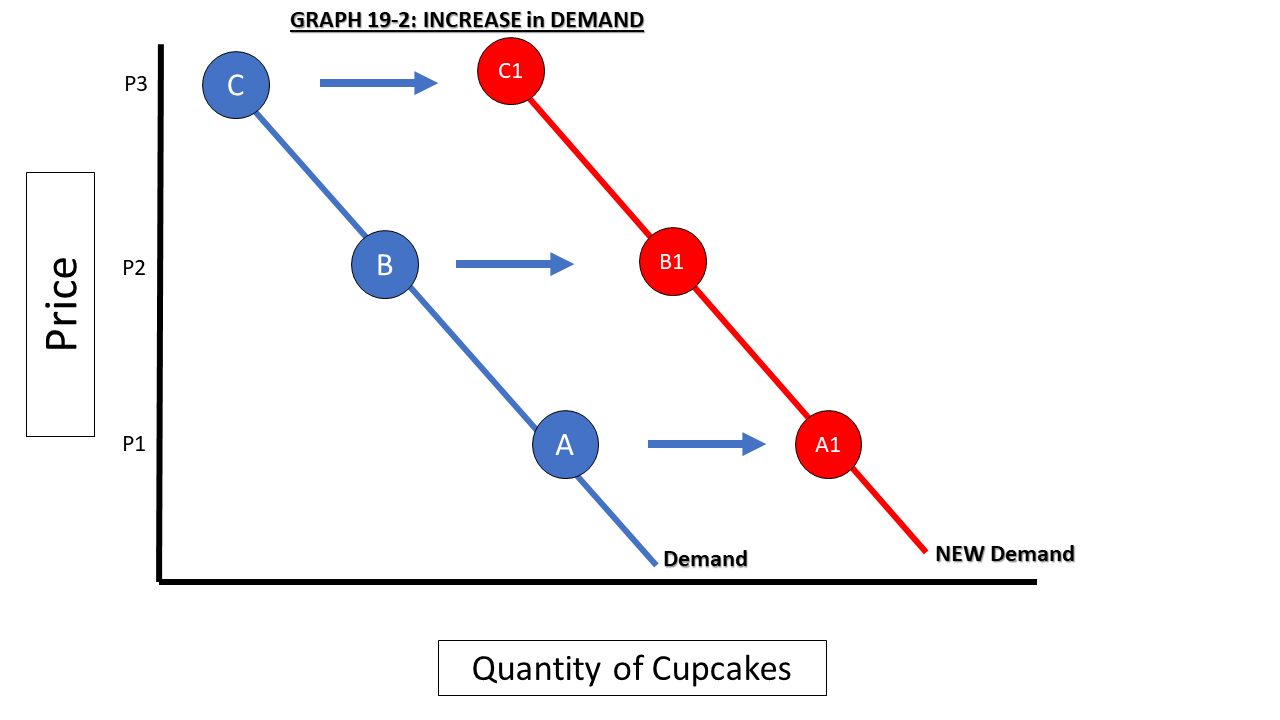
Let’s assume that, with no other changes in the market, the price of brownies – a substitute for cupcakes – drastically increases to the point where brownies cost twice as much as cupcakes. If the market prices of cupcakes remain the same, at each price at least some consumers will leave the brownie market and come over to the cupcake market. This will affect cheap, medium and high-priced cupcakes. So, at all possible prices, the quantity demanded of cupcakes will increase, and the entire demand line will shift right, as seen in Graph 19-2. This is called an increase in demand. Increases in demand are shown by shifting the entire line to the right. At every price, there is a greater quantity demanded.
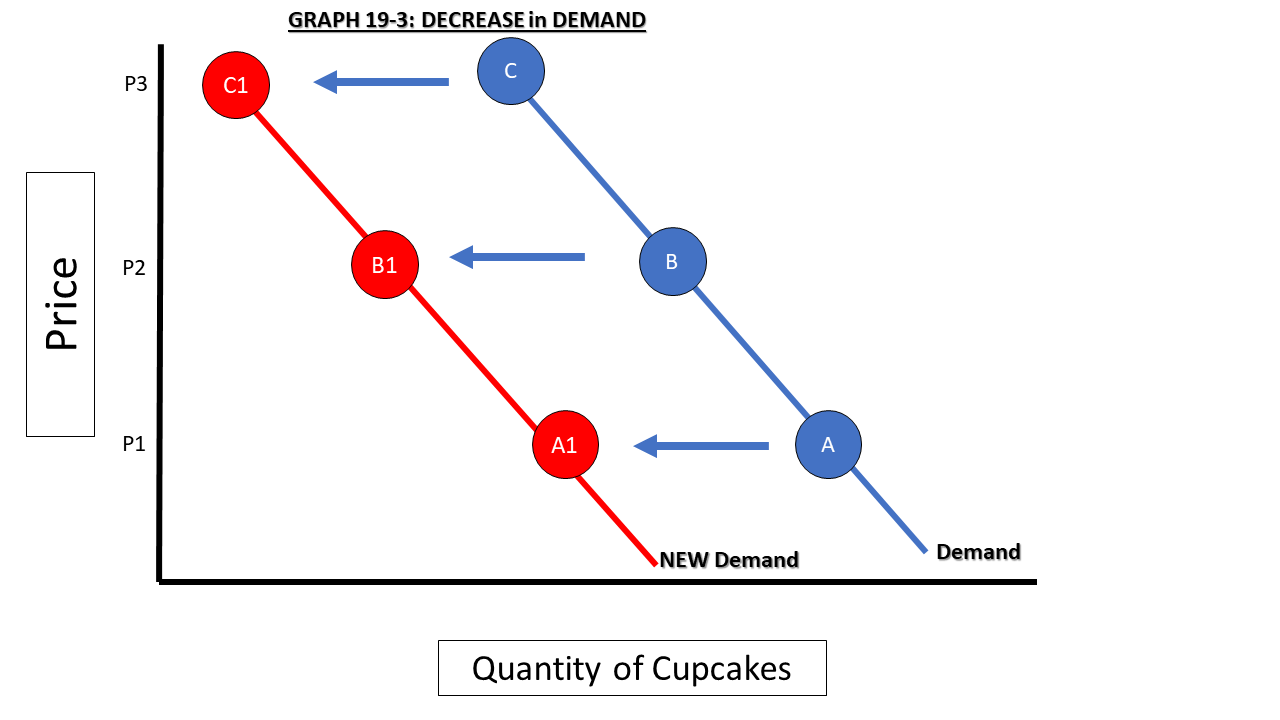
A decrease in demand works in the opposite manner. Assume, with no other changes in the market, a large portion of the population loses their jobs and a significant percentage of their disposable income. Now, not only are they less able to purchase goods and services in general, but something like cupcakes – which is likely a luxury good for many – becomes less important. Therefore, even though the price of cupcakes hasn’t changed, the quantity demanded at each possible price will decrease, and the entire demand line will shift left as seen in Graph 19-3. Decreases in demand are always shown by shifting the line left.
In summary, remember the acronym IRDL (pronounced er-dul) – Increase Right, Decrease Left to help you remember which direction to shift demand curves. Get in the habit of using left and right instead of up and down.
Advanced

In the intermediate section, you may have noticed we repeated the phrase “no other changes in the market” when explaining supply shifts. Essentially, we are freezing movement in the market. This important concept is referred to as ceteris paribus in economics, a Latin phrase that basically means “all things being equal.” It is used as a way to focus on one variable at a time. Think of it as removing the “what ifs” from a scenario. In order to see the effect of the change in resource prices in the cupcake market, we will assume that everything else in the market – the number of buyers and sellers, the taste of the cupcakes, store hours, income of the buyers, etc. is all exactly the same, and the ONLY change in the market is the price of the resources. That way we can focus on just that single change rather than trying to model multiple changes at once that may have conflicting influences on supply. Economic models are simplified representations of extremely complicated real-life behaviors and decision-making. Ceteris paribus is an extremely important concept in advanced economic analysis because it helps isolate variables.
Click a reading level below or scroll down to practice this concept.
Practice
Assess
Below are five questions about this concept. Choose the one best answer for each question and be sure to read the feedback given. Click “next question” to move on when ready.
Social Studies 2024
Describe various determinants (shifters) of supply and demand and illustrate on a graph how they can change equilibrium price and quantity.