Concept 21: Price Ceilings/Floors
Learn
Beginner
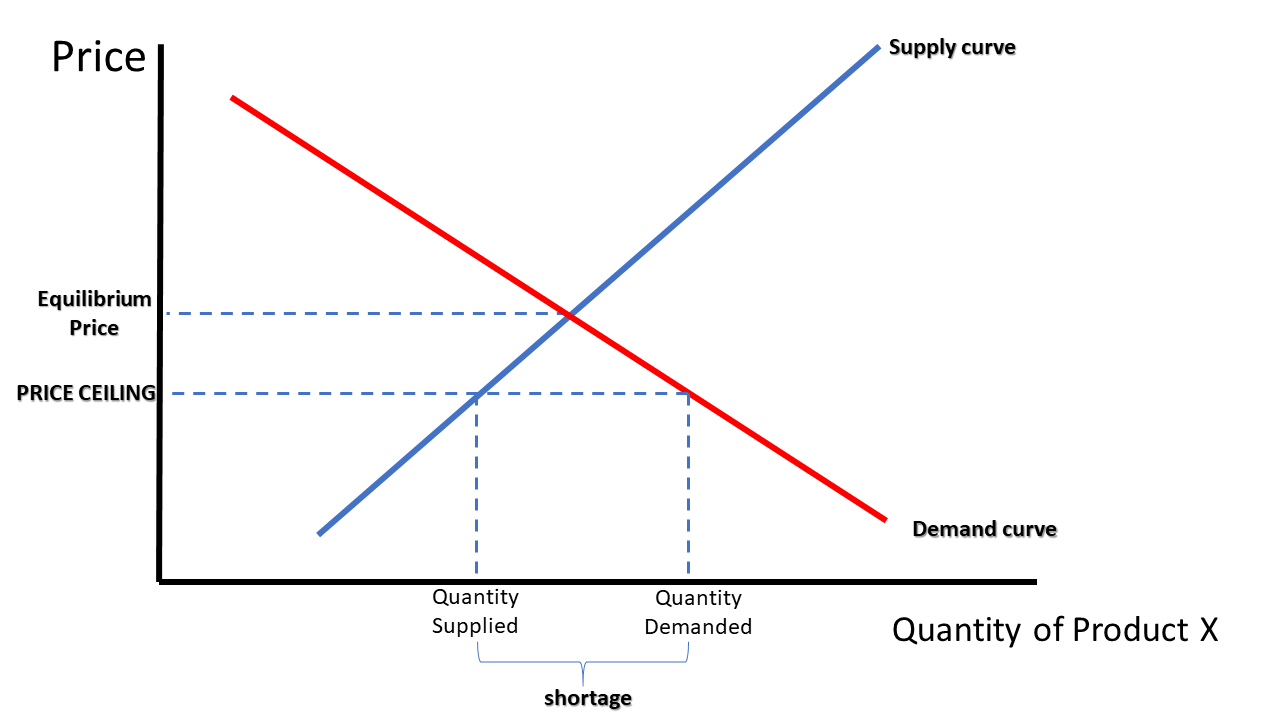
A price ceiling occurs in a market when a maximum price is imposed that is below equilibrium. The mandated price functions as a “ceiling” because it prevents the buyers and sellers from negotiating higher prices and reaching equilibrium. The result, seen in Graph 21-1, is a shortage in the market because at the price ceiling, the quantity demanded is greater than the quantity supplied.
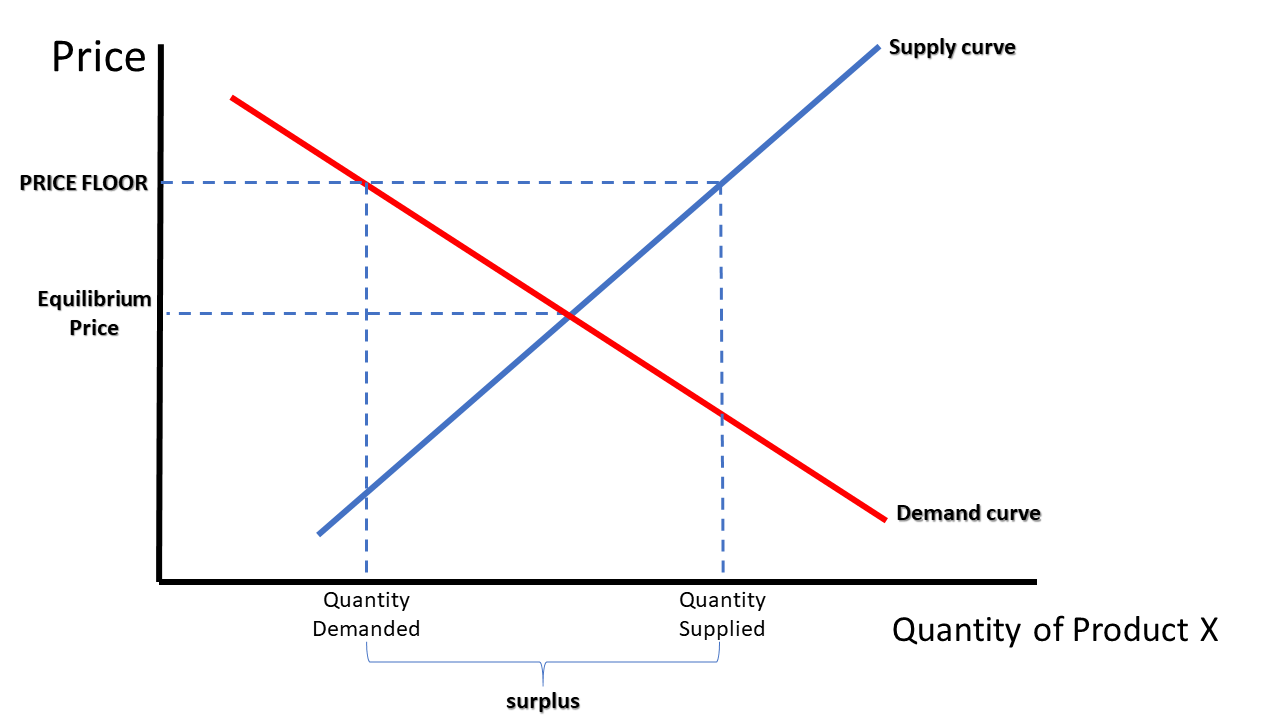
A price floor occurs in a market when government imposes a minimum price that is above equilibrium. The mandated price functions as a “floor” because it prevents the buyers and sellers from negotiating lower prices and reaching equilibrium. The result, seen in Graph 21-2, is a surplus in the market because at the price floor, quantity supplied is greater than quantity demanded.
Intermediate
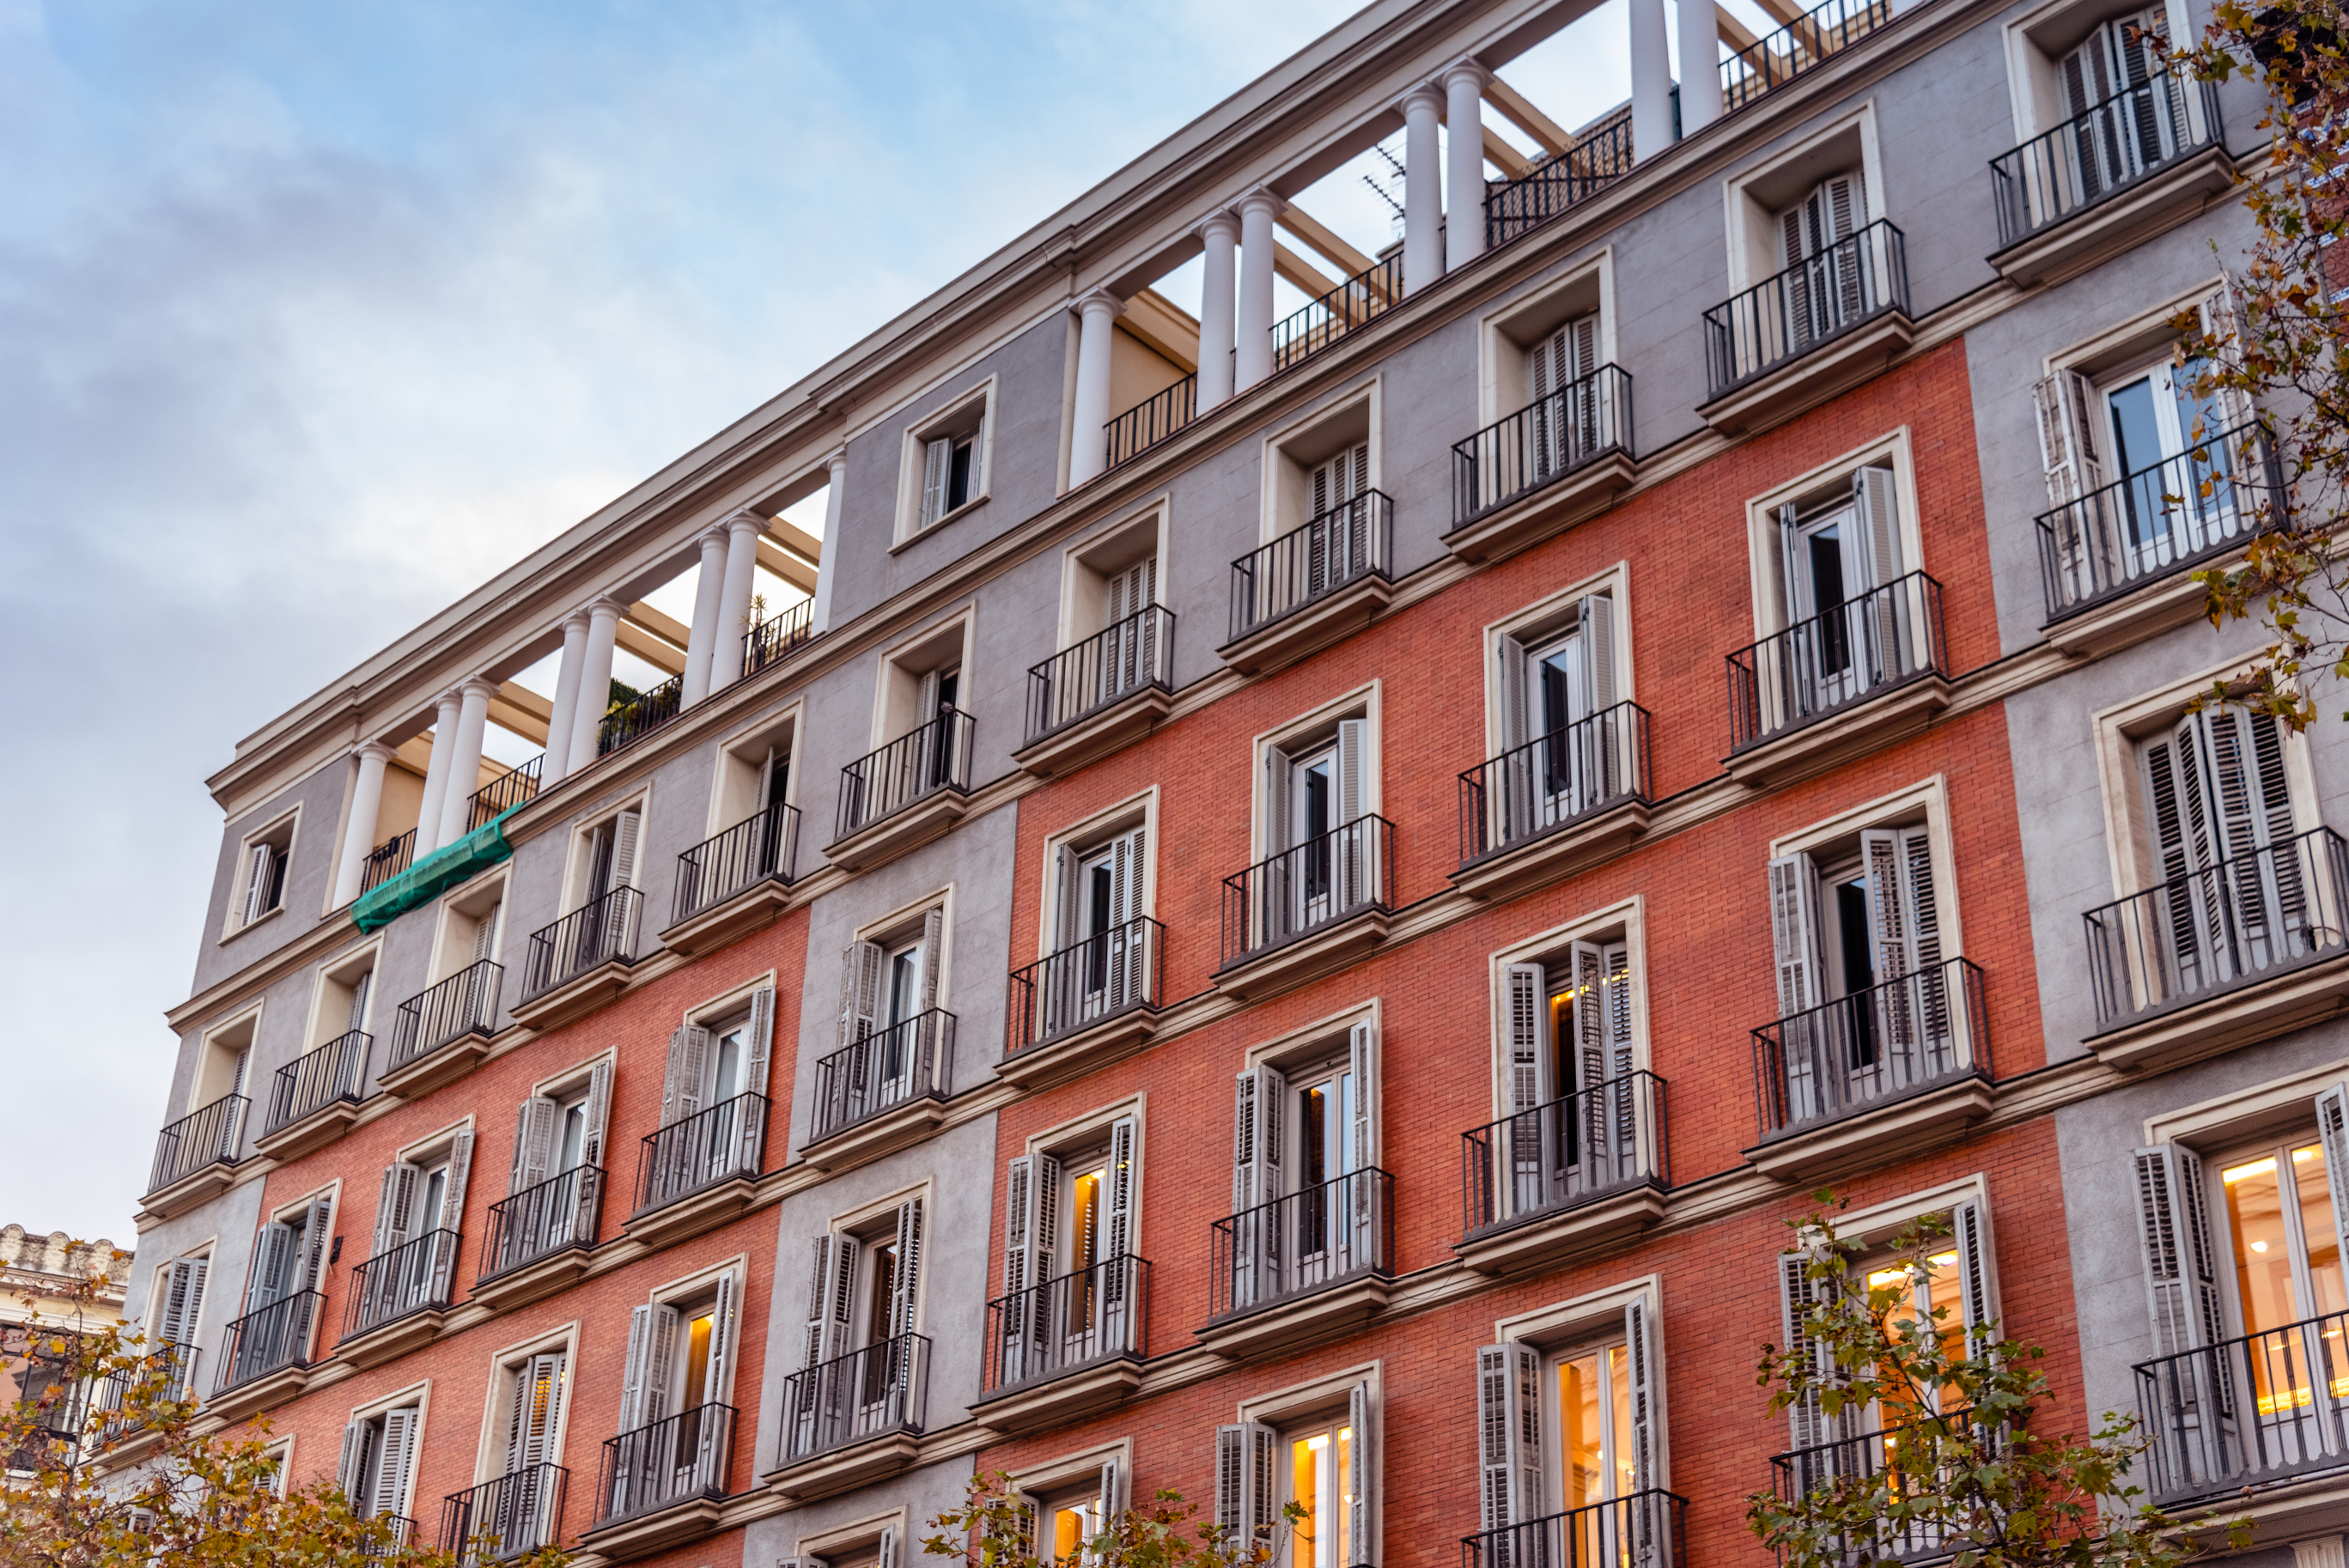
A real-life example of a price ceiling is rent control. In some cities, the government limits the amount landlords can charge for an apartment or rental house. These policies are usually an effort to keep housing affordable for low-income residents. Over time, as costs of maintenance, property taxes and other operating costs rise, landlords have less incentive to build or renovate housing, since there is less profit. At the same time, the quantity of housing demanded by consumers at this rental price increases, and a shortage occurs.
Minimum wage is one of the most common examples of a price floor. While there is a federal minimum wage, many states and cities have their own laws in place that require a minimum wage higher than the federal level. This higher wage encourages workers (the sellers of labor in this case) to offer a higher quantity of labor. The businesses (buyers of labor) are less able to purchase workers at higher prices. A potential result of this, then, is a surplus of labor with more workers willing to work than jobs available at this wage. Guaranteed prices for agricultural products is another example of price floors with similar results, a surplus of products like corn and peanuts.
Advanced

To this point we have presented price ceilings and price floors as government mandated price controls. In some markets, however, the same principles behind price ceilings and floors operate without government influence.
Concert or sporting event ticket prices are an example of a type of price ceiling that is not set by government, but by the venue or artist. The price of the tickets is set based on anticipated demand and tickets released. With very popular artists, the quantity demanded often outpaces the available supply (which is a perfectly inelastic line at the quantity of seats available) leading to a sellout. This leads to a situation where people who purchased seats at the original price may decide to re-sell them in a secondary market for a higher price where neither the venue nor the artist receives the profit. Some countries that have tried to use price ceilings have experienced problems with hoarding as consumers buy and hold as much of a product as they can at the lower price.
Price floors also cause unintended consequences. In countries that have used price floors to encourage agricultural production, farmers have to deal with issues like storage of excess production, expiration of otherwise good food, and problems planning for future production when the price supports disappear.
Price controls can have effects like this because they interfere with the natural interaction of buyers and sellers.
Click a reading level below or scroll down to practice this concept.
Practice
Assess
Below are five questions about this concept. Choose the one best answer for each question and be sure to read the feedback given. Click “next question” to move on when ready.
Social Studies 2024
Explain and illustrate on a graph how prices set too high (e.g., price floors) create surpluses, and prices set too low (e.g., price ceilings) create shortages.