Concept 29: Business Cycle
Learn
Beginner
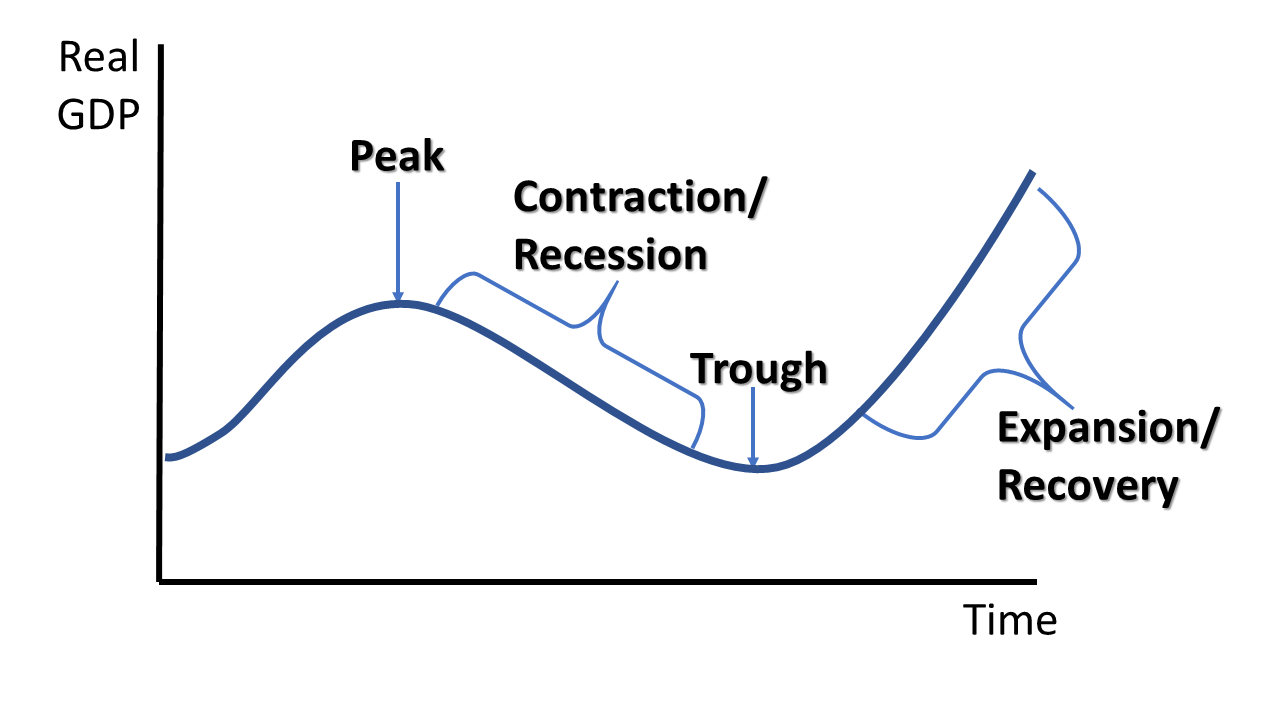
In macroeconomics, the business cycle refers to a specific model of an economy that shows the increases and decreases in GDP over time. The business cycle is usually expressed as a graph like Graph 29-1. The specific labels are described in more detail in the intermediate section.
Intermediate
Components of the business cycle as seen in Graph 29-1:
- Real GDP: the amount of goods and services produced within a country’s borders adjusted for inflation
- Time: this is most commonly expressed in quarters (3-month intervals), but monthly and yearly graphs are also common
- Peak: GDP is higher than it has been for some time (maybe ever), unemployment is low (perhaps its lowest ever) and there are inflationary pressures as spending may outpace production
- Contraction/Recession: GDP growth slows or may even turn negative; unemployment rises; and inflationary pressures slow down or turn negative
- Trough: GDP is at its lowest point in a given time frame, unemployment is at its highest point, and there are little to no inflationary pressures because there are so many unemployed and underutilized resources
- Expansion: GDP begins to increase again, unemployment decreases, and eventually inflation begins to rise
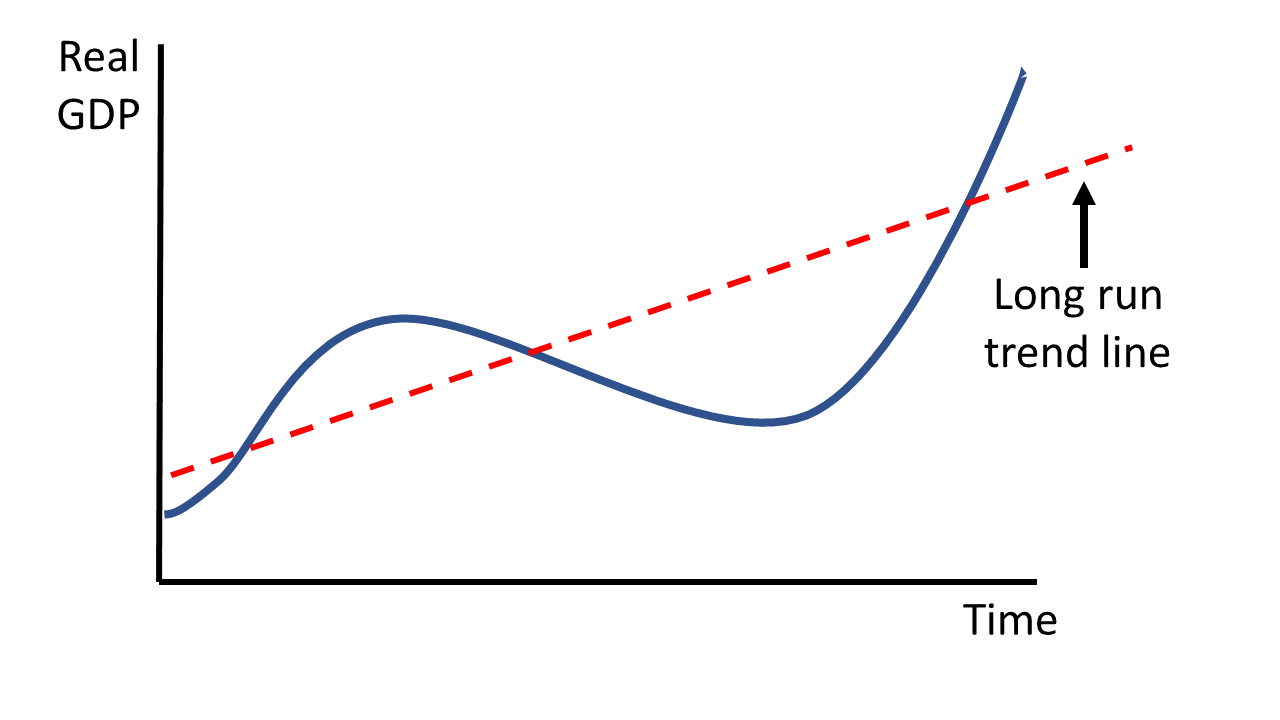
For most economies, the general trend of an economy is to grow, even though there may be periods of ups and downs with GDP. This general trend is shown on Graph 29-2.
Advanced
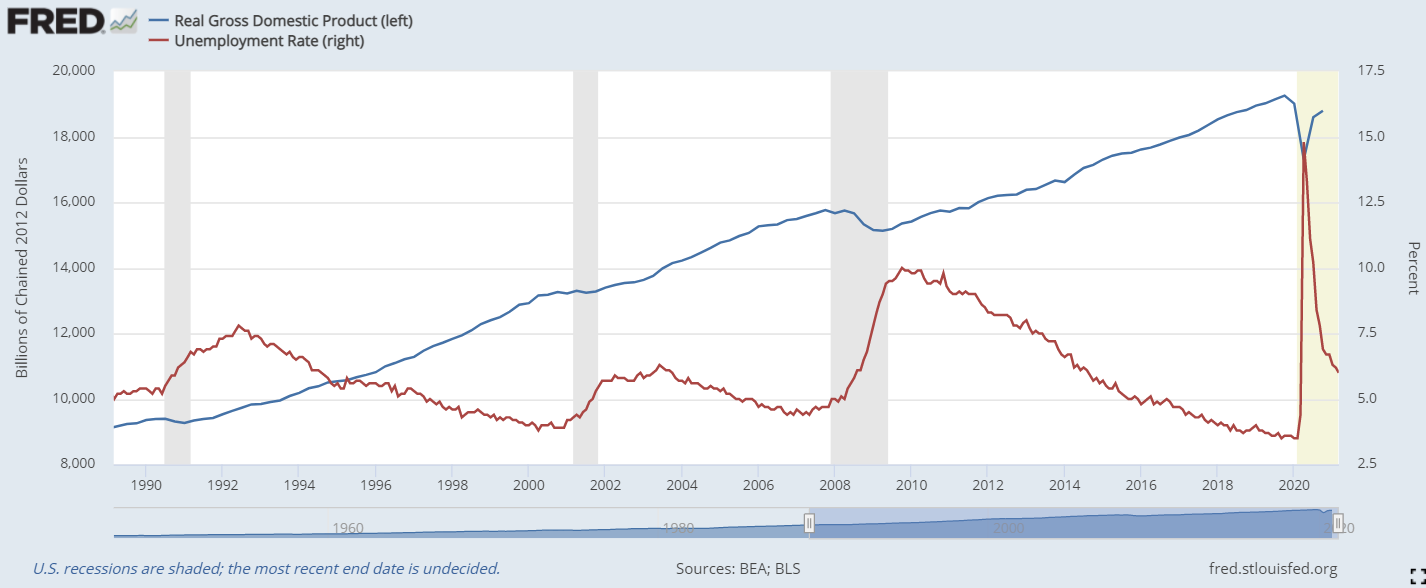
One of the best online tools for creating business cycles for the United States with real data is the FRED Database from the Federal Reserve Bank of St. Louis. You can view GDP, unemployment and inflation data for various time frames and even identify specific periods of recessions with markings on the graph. On the graph above, for example, you can see how unemployment rises during the recessions marked by the gray bars. It is important to remember that a business cycle is a useful historical research model, but it is not necessarily predictive. All of the measures used in a business cycle are “lagging” indicators. Economists like to say “you never know which part of the business cycle you’re on until you’re past it.”
Click a reading level below or scroll down to practice this concept.
Practice
Assess
Below are five questions about this concept. Choose the one best answer for each question and be sure to read the feedback given. Click “next question” to move on when ready.
Social Studies 2024
Describe the stages of the business cycle and its relation to economic measurement, including: peak, contraction, trough, recovery/expansion as well as recession.