Concept 28: Aggregate Supply and Demand
Overview: Just like individual markets have supply and demand, there is also supply and demand for an entire country. This concept explains the similarities and differences.
Learn
Beginner
In Concepts 16-20, we presented basic supply and demand. In those examples, we were only concerned with supply and demand for a single good or service, like coffee or corn. Macroeconomics focuses on the entire economy and, therefore, all of the markets functioning in that economy. Aggregate Supply is the total quantity of all goods and services produced in an economy at all possible price levels at a given time. Aggregate Demand is the total quantity of all goods and services consumed in an economy at all possible price levels at a given time. The words total and price levels are important here.
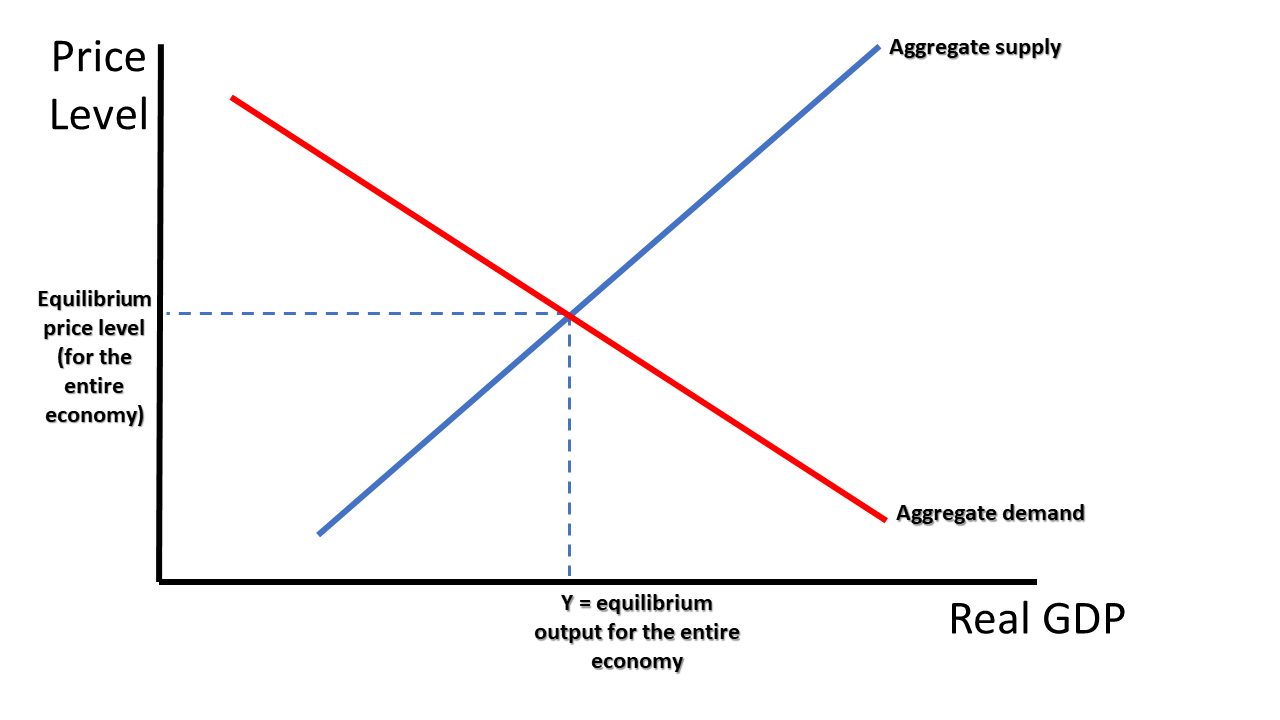
You can see on Graph 28-1 what appears to be a supply and demand graph. Upon closer inspection, however, you will see that the Y-axis is labeled “price level” instead of price. This is because we are representing all of the prices for all of the goods and services bought and sold in this economy, using a price index (like the CPI, described in Concept 26). You’ll notice the X-axis is labeled “Real GDP” instead of quantity because we are representing the total amount of goods and services produced and consumed by the entire economy, not the quantity of one good. (See Concept 25 for more about GDP.)
The point where the aggregate supply line crosses the aggregate demand line is the short run equilibrium output and price level for the economy.
Intermediate
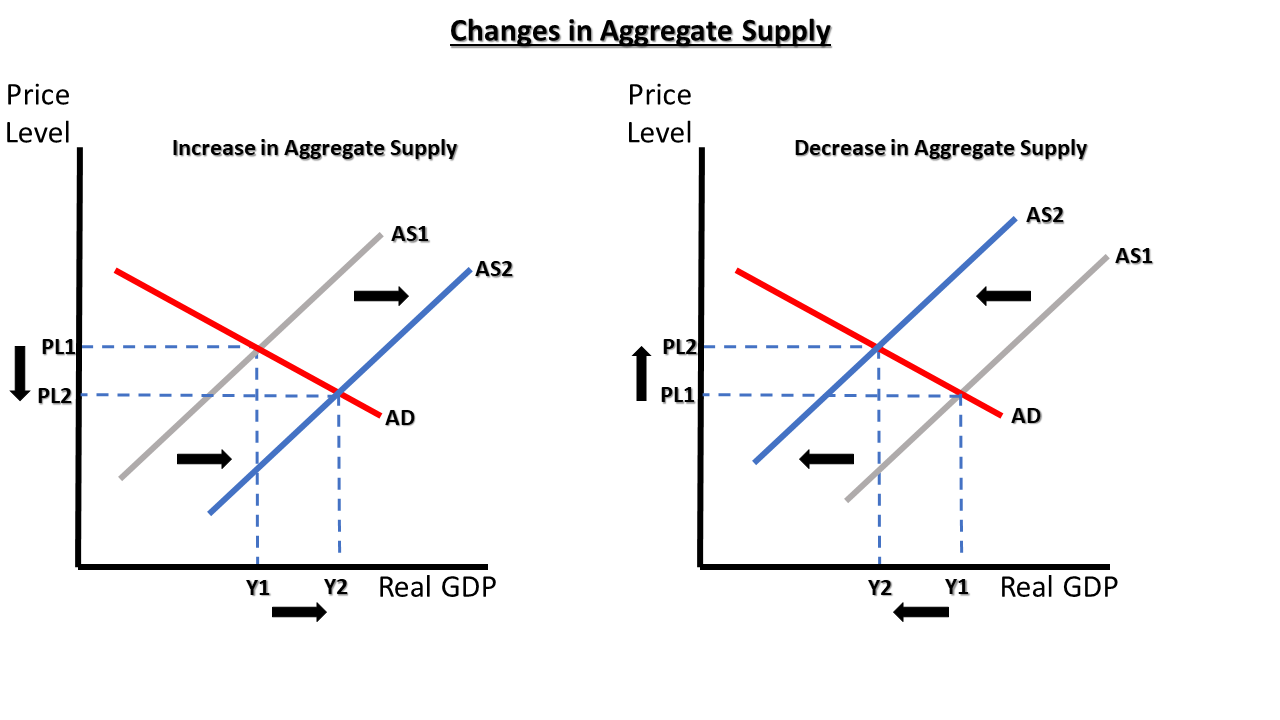
Much like regular supply, aggregate supply can shift left or right based on a few determinants. Since aggregate supply represents the entire economy, changes to overall wages, land prices, capital investments, education level or other nation-wide supply-chain factors can shift an entire nation’s production capacity. You can see the results of these shifts in Graph 28-2.
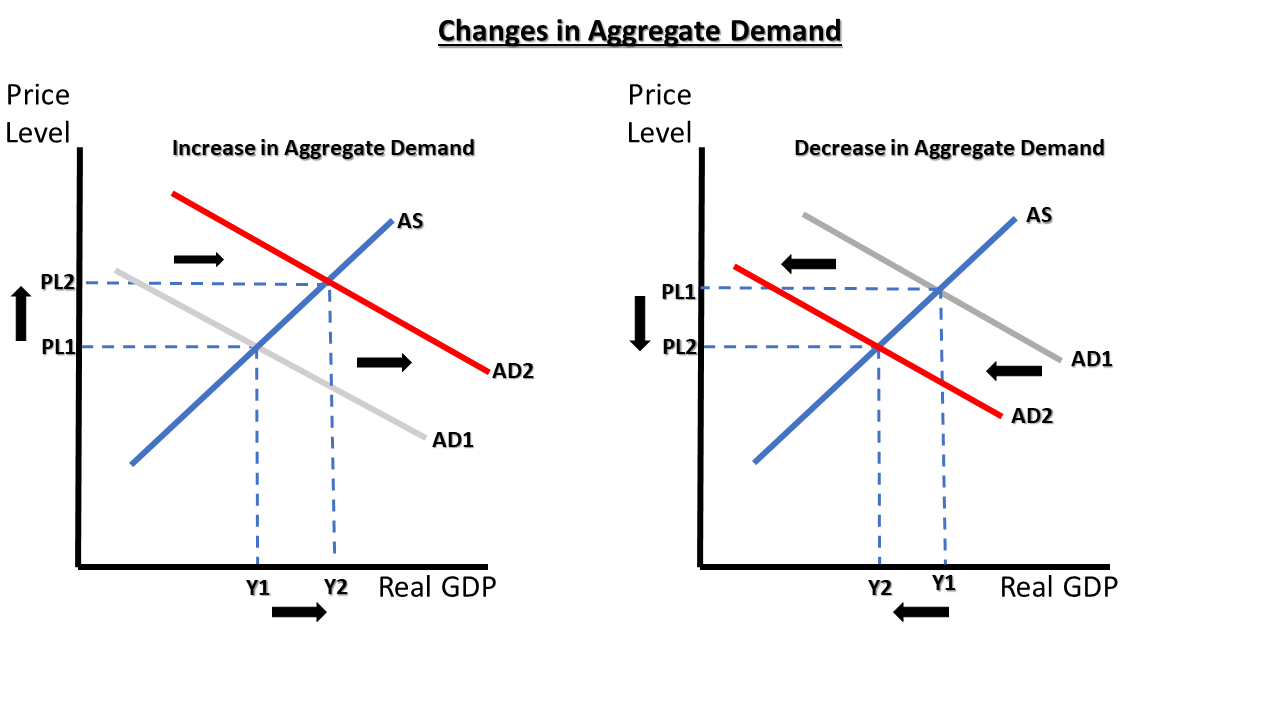
Aggregate demand is comprised of the demand from all the sectors in the economy. Therefore, changes in consumption habits by consumers, businesses, governments, or other countries who buy our exports can shift aggregate demand left or right. You may recognize these four components as the same four that are used to determine the GDP for a country, as seen in Concept 25 You can see the results of changes in aggregate demand in Graph 28-3.
Advanced
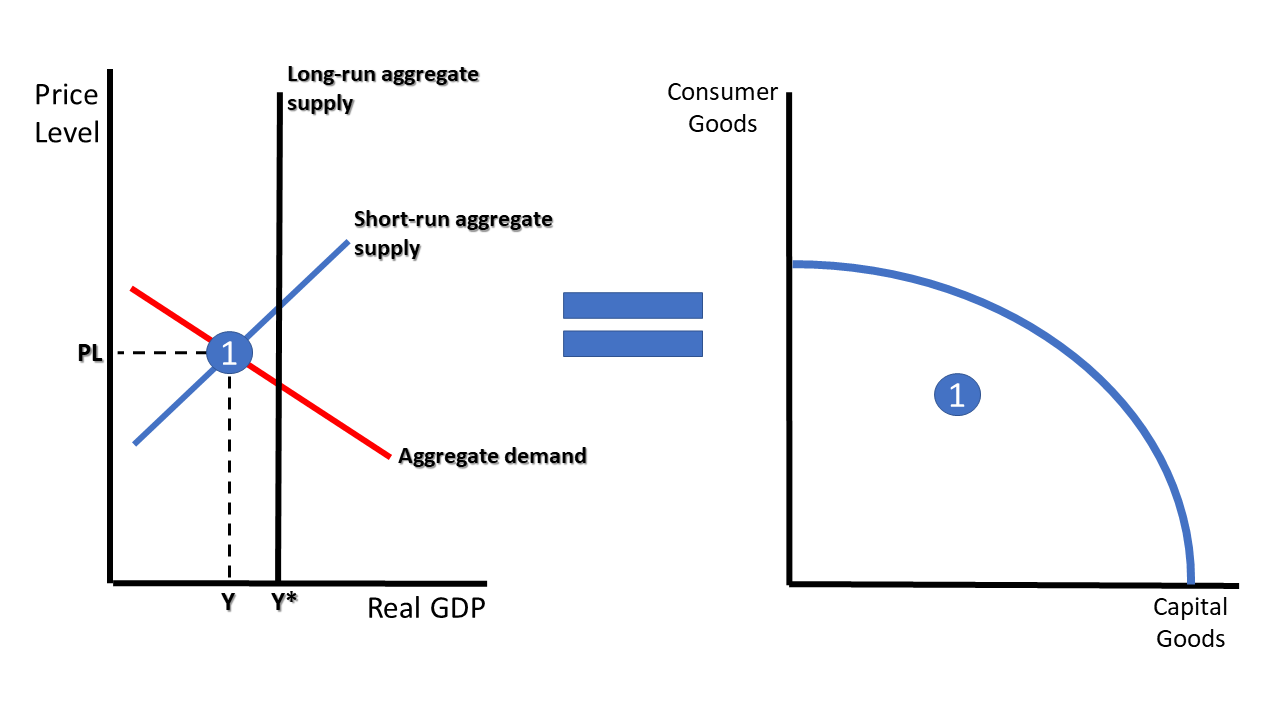
Aggregate supply has a unique feature in the long run. Since all economies have limited resources, there is some maximum quantity of goods and services that can be produced at any given time. Graphically, this is shown by a vertical line called the long run aggregate supply (LRAS) line.
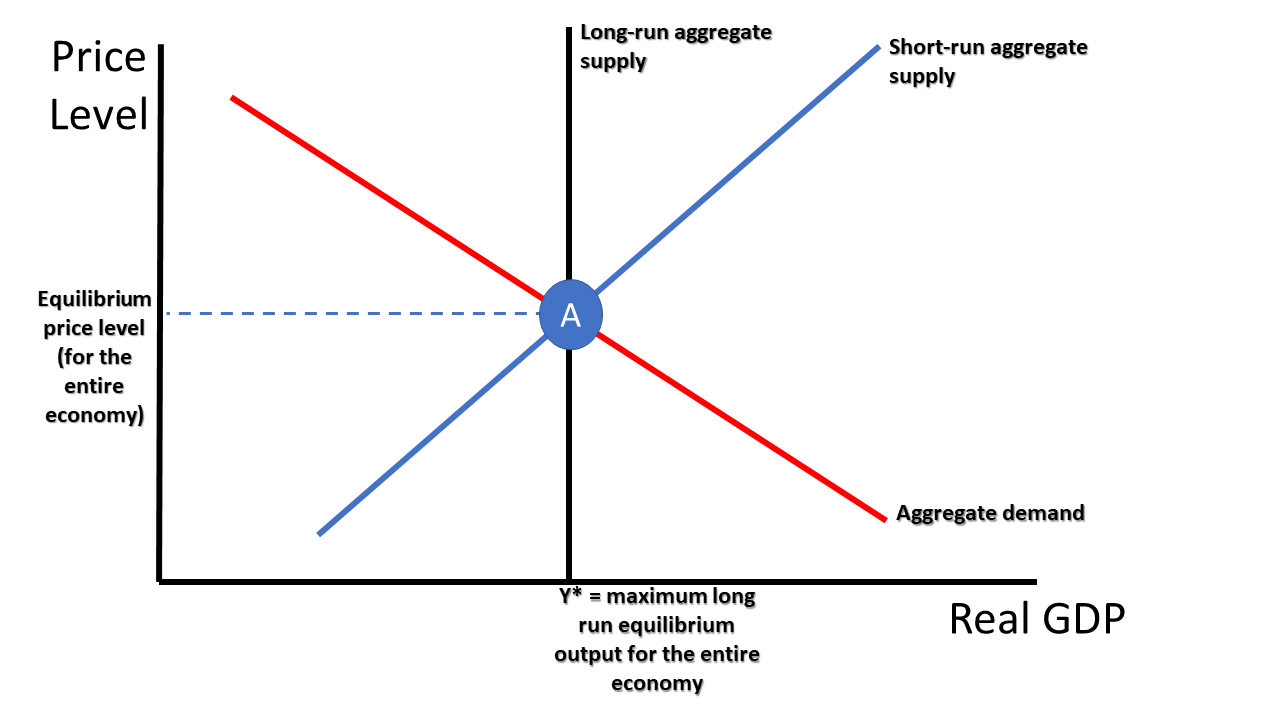
If the economy is operating at the point where the aggregate demand line crosses this LRAS line (point A in Graph 28-4) the economy is producing at its full employment capacity (and is also on its production possibilities curve).
At any point to the left of this line, the economy has unemployed resources (it is operating below its PPC) and the economy would be experiencing a “recessionary gap”, as seen in Graph 28-5.
At any point to the right, the economy would be experiencing an “inflationary gap” as there would be pressure on resources to over produce. This would be represented temporarily as an unsustainable point outside the PPC, as seen in Graph 28-6.

Click a reading level below or scroll down to practice this concept.
Practice
Assess
Below are five questions about this concept. Choose the one best answer for each question and be sure to read the feedback given. Click “next question” to move on when ready.