
Caption
A tomato from MercyMed Farm that has yellow ‘shoulder stress’ from excessive heat. Photo taken Aug. 16, 2023.
Credit: Photo courtesy of Keith Sims.
It’s been hot this summer. Searing, scorching, oppressively warm.
In fact, July was the hottest month, globally, ever recorded, breaking the previous mark that was set just one month prior.
“Going back 100,000 years, it was the hottest month ever on planet Earth,” Andrew Pershing, climate science director at the nonprofit Climate Central, said. In fact, “6.8 billion people, more than 81% of the global population experienced climate change-attributed heat.”
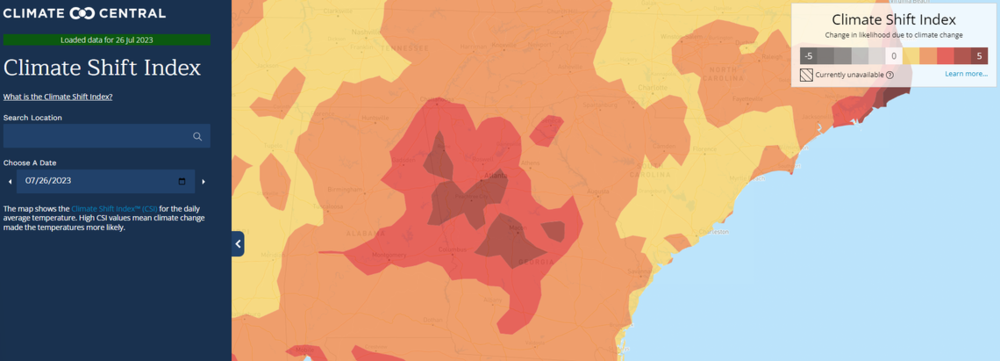
But how much of this global heat wave is due to climate change, and how much of can we chalk up to natural factors? There is a tool from Climate Central to answer that question, the Climate Shift Index.
The attribution that Pershing is referring to comes from a tool that the foundation, Climate Central, created last year called the Climate Shift Index (CSI). The CSI uses a “multi-method” approach to quantify the likelihood that weather on a particular day was in fact attributed to climate change.
For years the Intergovernmental Panel on Climate Change (IPCC) has connected the record-breaking heat of Earth’s average temperature to climate change. Now, the CSI allows anyone to find out if the temperature they are experiencing is actually because of human-caused climate change.
The CSI has varying levels of confidence in which extreme weather can be related to climate change. Anywhere that has a yellow color on the map (level 1) has a detectable, quantifiable impact on a day’s temperature. This goes all the way up to level 5 (suggesting an event was 5x — very likely — because of climate change) and all the way down to -5 (suggesting this was very unlikely that the temperature was related to climate change).
The CSI-level methodology was created by Pershing and climate scientist Daniel Gilford. They use 22 climate models that are made with and without historical greenhouse gas data and then specifically look at the frequency of daily temperatures in the last 30 years, and remove the counterfactuals to reveal how likely an event would have occurred historically without climate change.
The South is notoriously hot in the summertime. But there are days that scientists can now say with a degree of certainty that some days were climate change-heat days.
“July was record-breaking for Georgia,” Nyasha Dunkley, climatologist for the State of Georgia said. “It was the fifth hottest July on record, in Georgia, since 1879.”
In the evening Georgia experienced above normal temps as well. In July, the minimum average for the state was 71 F, about 2 degrees above normal, according to Nyasha. Lower evening temperatures are important: they allow mammals to cool down and regulate body temperatures.
“When nights are hot, humans and other mammals cannot recover from the heat and experience more stress that affects health,” Pam Knox, an agricultural climatologist at UGA, said. “Cattle eat less, give less milk if they are dairy cows or gain less weight if they are beef cows.”
Columbus’ MercyMed farms provides locally grown organic produce for hundreds of local residents via their Friday farm stand and at Food Mill. July heat affected carrots, butter lettuce and tomatoes.
“Our carrots didn’t germinate in July, so that means no carrots in October,” Keith Sims, MercyMed farm manager, said. “The night time temperature is a good indicator of soil temperature, which dictates what could germinate. Seventy degrees is the perfect soil temperature.” The tomato’s color will change when they are stressed. “The tomatoes get shoulder stress and turn yellow, and the quality isn’t sellable,” Sims said.
Sims and the other farmers are only able to work outdoors between 6 a.m. and noon due to the heat.
Columbus experienced level 3 heat and above for seven days between July 18-29.
The last five days in August of extreme heat in Columbus have all been at level 3 and above, several at level 5, meaning the heat has been three-to-five times more likely this week because of human-caused climate change.
On Aug. 15, the low was 73 degrees F. This heat was 5x more likely due to climate change, according to Climate Central.
“Georgians didn’t escape the influence of climate change during the hottest month in recorded history,” Peter Girard, vice president of communication at Climate Central, said. “Residents of Atlanta were exposed to five days of warm temperatures made at least three times more likely by the carbon pollution in Earth’s atmosphere, and residents across the state felt increased heat attributable to global warming.”
Atlanta experienced climate-related heat, according to CSI’s data, halfway through July while Augusta encountered it early in the month.
On July 26 Atlanta and Macon experienced temperatures that were four times as likely due to climate change and Columbus’ temperatures that day were three times as likely due to climate change.
If you want to receive alerts from Climate Central for your area, you can sign up here: climatecentral.org/media-signup.
This story comes to GPB through a reporting partnership with the Ledger-Enquirer.