Concept 14: Production Possibilities Curves
Learn
Beginner
A production possibilities curve or frontier (PPC or PPF) is a model used in economics to analyze tradeoffs and opportunity costs. The model assumes that one producer or country, using all of their productive resources, can produce two goods or two categories of goods – for example, regular soda or diet soda, military goods or consumer goods.
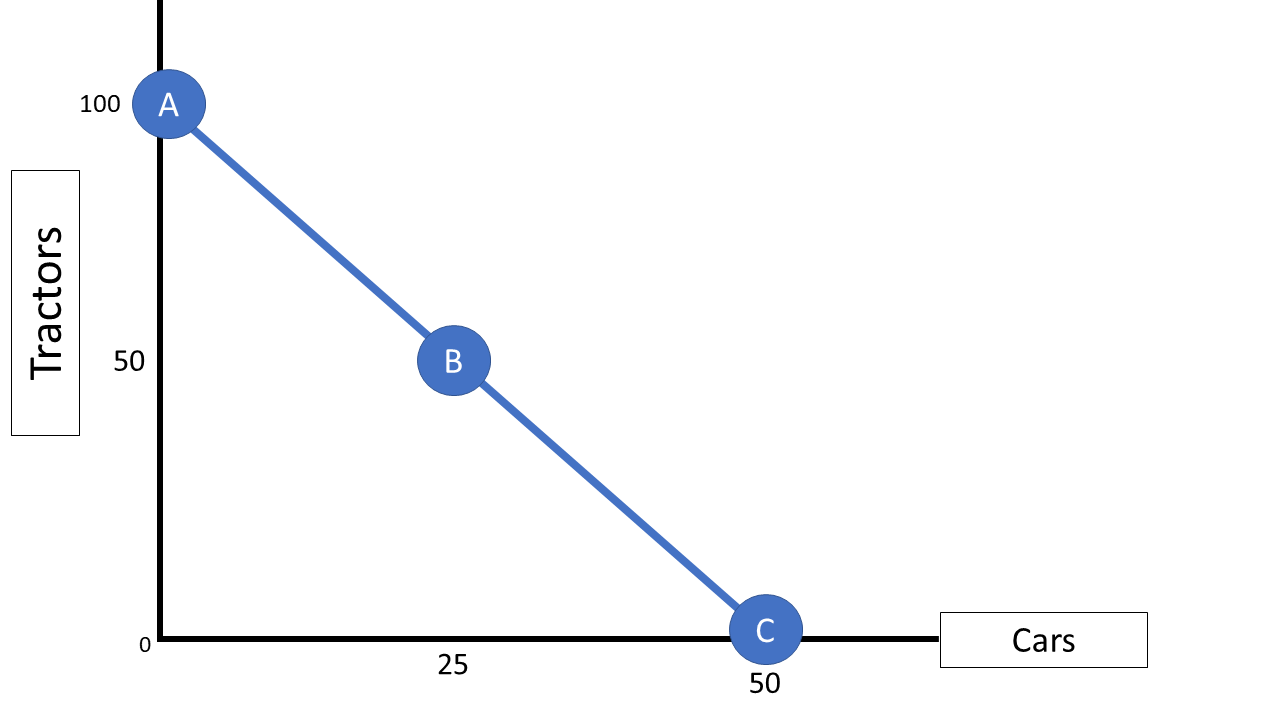
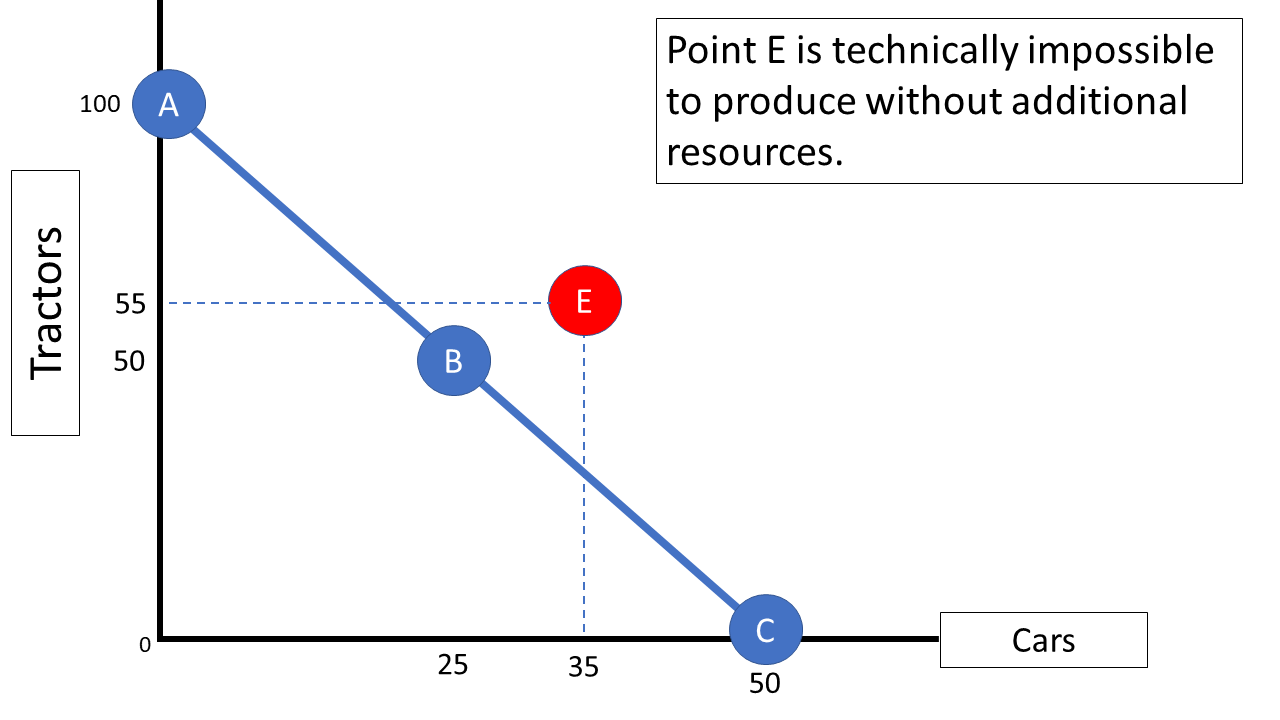
Graph 14-1 shows a theoretical factory that can be set up to produce tractors or cars. If it produces ONLY tractors, it can produce a maximum of 100 per day (point A on the graph). If it produces ONLY cars, it can produce a maximum of 50 per day (point C on the graph). From this, we can infer that cars require more resources (time, technical expertise, materials, etc.) to produce. The factory owners may choose to allocate half of their resources to tractors and half to cars and produce at point B. Connecting points A, B and C with a line creates a PPC. Importantly, all points on the line are potential output combinations.
All PPC models use this same logic, no matter what is being produced. Any point along a PPC is considered “productively efficient,” which means the producer or nation is using all of its productive resources as efficiently as possible. The combination of goods the party chooses to produce can be influenced by preferences or market demand.
Intermediate
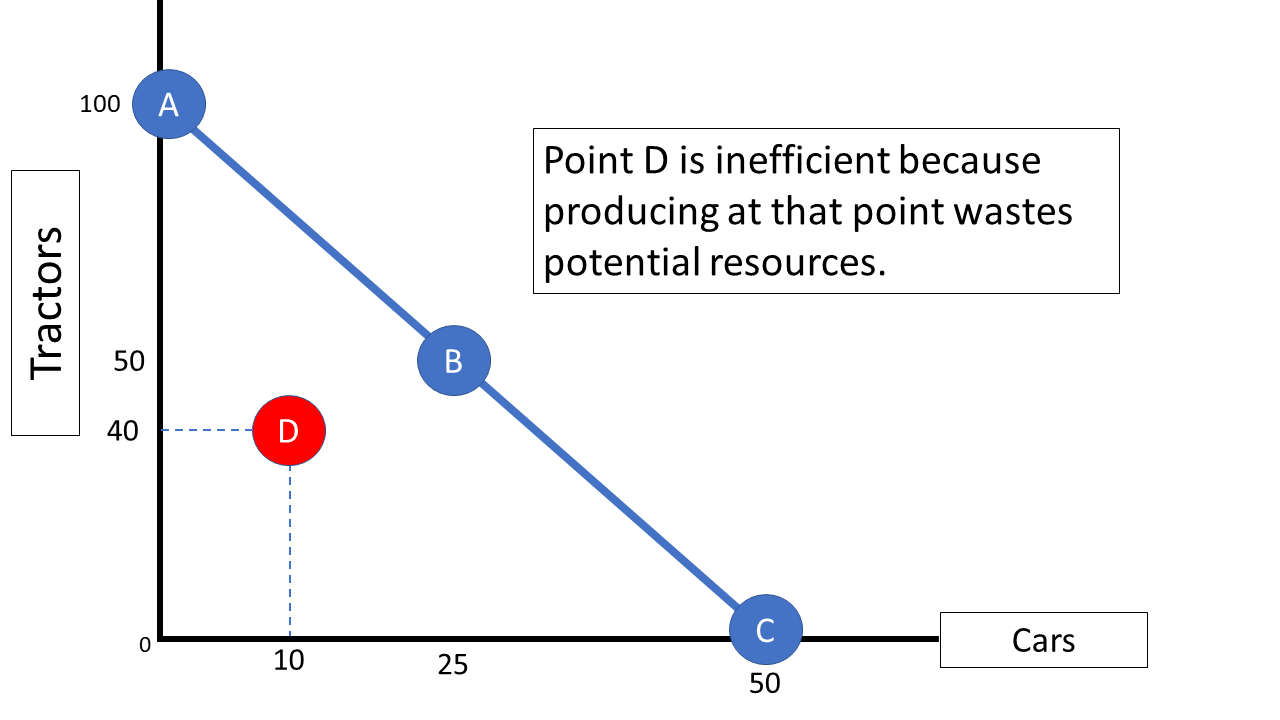
Individuals, businesses and countries are not always efficient and sometimes waste resources. Using the factory from the beginner reading, assume that one day, several of the workers goof off, take a longer lunch break, and clock out early. At the end of that day, the manager looks at the production numbers and sees that 40 tractors and 10 cars were produced. On Graph 14-2, this is shown by point D. In this scenario, some resources (time and skill) were wasted, thus the company did not produce to its full potential. Any point under a PPC is considered inefficient or wasteful.
According to the model, any point beyond or “above” the line is technically impossible to achieve. See point E on graph 14-3 for example. There aren’t enough resources, for example, to produce 55 tractors AND 35 cars. For that to happen, the company would need to purchase more metal, hire more workers, or run the assembly line longer (or all three). In that case, the entire line would shift to the right. In this way, a PPC can demonstrate economic growth in one or both goods found on the graph.
Advanced
A PPC is a visual way to represent opportunity cost. If the factory is producing 100 tractors and decides to produce one car, it must re-allocate resources that were being used to make two tractors. This would put the factory at a new point on the PPC:98 tractors, 1 car. A second car would cost the company two more tractors, putting them at 96 tractors, 2 cars, and so on. Every car costs two tractors, and every tractor costs half a car. If these costs remain the same, the PPC will be a straight line, indicating that opportunity costs are constant.
In real life, resources are not usually perfectly interchangeable between different uses. It is likely that some workers in this factory are more skilled at assembling tractors than cars. The first few cars can probably be produced without sacrificing many tractors. As more and more cars are produced, however, some of those skilled tractor workers get pulled away from tractors, and tractor output decreases by more than two per car. In this case, the cost to produce cars actually increases. This is called increasing opportunity cost and is represented by a curved line like the one seen in Graph 14-4.
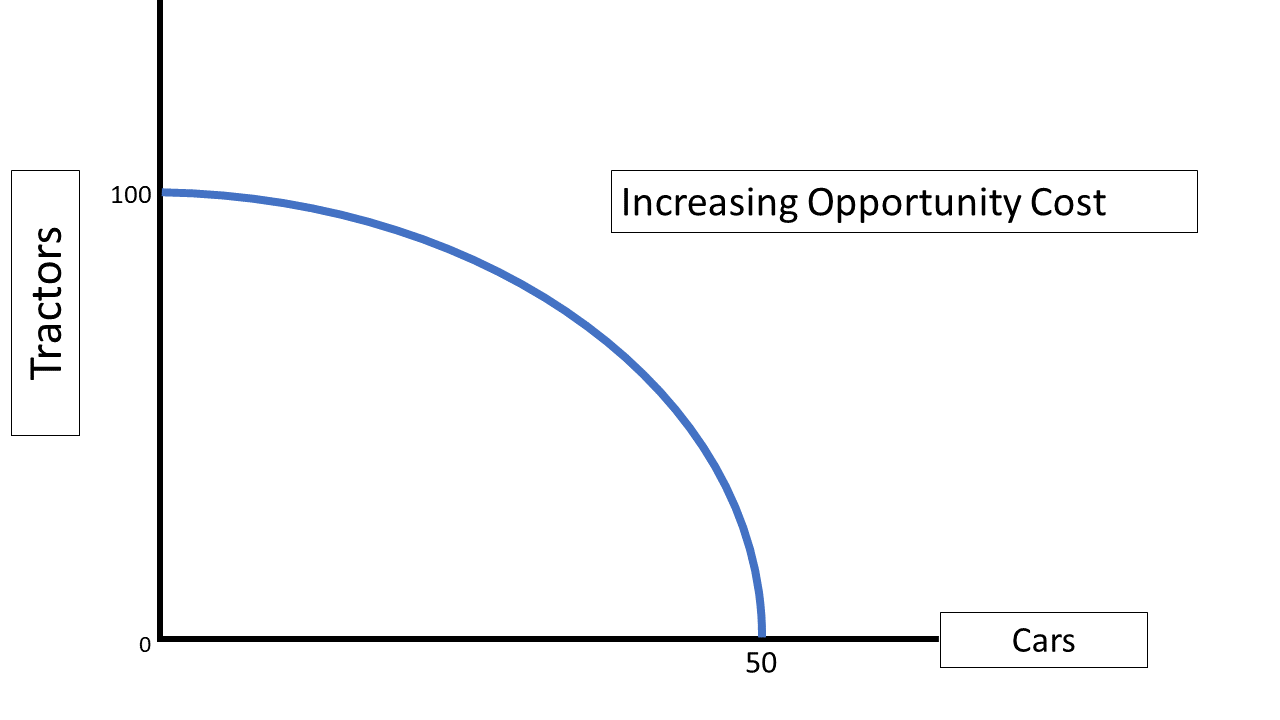
Increasing opportunity cost is more realistic, but constant opportunity cost curves are sometimes more useful for demonstrating concepts like comparative advantage.
Click a reading level below or scroll down to practice this concept.
Practice
Assess
Below are five questions about this concept. Choose the one best answer for each question and be sure to read the feedback given. Click “next question” to move on when ready.
Social Studies 2024
Illustrate economic growth using a production possibilities curve.