Banner Image
Blog

Section Branding
Header Content
Looking Back at April 27, 2011
Primary Content
On the anniversary of significant weather events, it is difficult not to look back and ponder Mother Nature's appetite for destruction. From the Blizzard of '93 to Hurricane Katrina in 2005, weather continues to impact our society on a nation-wide scale. The severe weather event that took place on April 27, 2011 is no different. On this one year anniversary, it is important to look back and remember the significance of the event.

This is the Day 1 Categorical Severe Weather Outlook produced by the Storm Prediction Center in Norman, Oklahoma. A moderate risk of severe weather was expected for many states in the southeast, and a high risk of severe weather was designated for a third of Alabama and a portion of northwest Georgia. The Storm Prediction Center was concerned about a major severe weather outbreak complete with large hail and strong tornadoes, with the majority of the severe weather occurring in Alabama.

This is the storm report totals submitted to the Storm Prediction Center from local National Weather Service offices within the country. According to the SPC, 292 tornadoes touched down on April 27, 2011 alone; historically, the entire month of April 2011 is listed as "the most active tornado month on record with 758 tornadoes" (Source: NOAA). While April 27th proved to be the most noteworthy date, the entire severe weather event spanned from April 25th - 28th; throughout the country, 321 people were killed during this severe weather outbreak (Source: NOAA).
So what caused this event to happen? What were the "ingredients" that came together to produce this batch of severe weather?

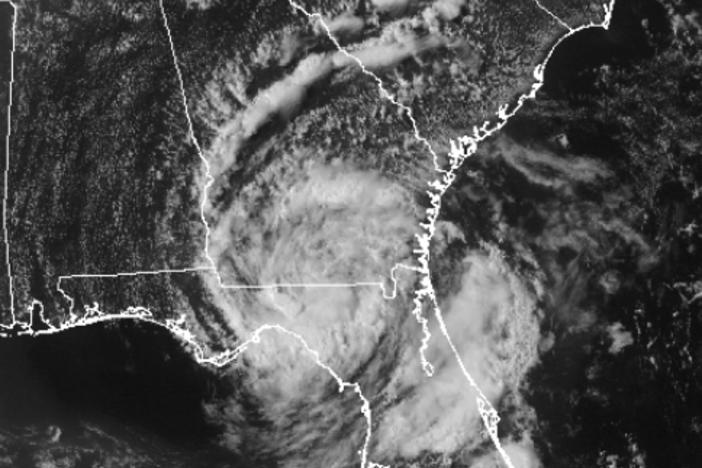
Severe weather is associated with low pressure, and in the case of April 27, the low pressure system was swinging through the heart of the southeastern states. The low pressure system pulled warm, moist air ahead of it; cold, dry air was pulled into the system behind it. The clash of the air masses played a part in the severe weather outbreak, but that was only part of the picture.

Higher up in the atmosphere (roughly 9km, or 5.6 miles), the 300 millibar map shows that a dip in the jet stream developed which produced a "trough" (upper level troughs support surface level low pressure systems; the blue ribbon in the map represents the jet stream). Ahead of the trough, wind is flowing from the southwest, yet the wind appears to "fork" in different directions. This "fork" is called diffluence, which is a fancy scientific term that means the air is flowing away from the low in multiple directions. A patch of closely bunched yellow lines indicates areas of divergence - divergence in the upper atmosphere creates a "suction effect" at the surface level, which further enhances thunderstorm development. (Personally, I think of upper level divergence as a vacuum cleaner sucking the air up from the ground - weird, I know, but it helps me understand the concept when I'm thinking about it. Besides, lots of vacuum cleaner companies put a picture of a tornado on their products - they're diverging dirt out our carpets, right? Right?! Okay, I'll move on...)
Taking another look at the surface map, the wind ahead of the low is flowing from due south. Comparing this wind direction from the surface to the wind direction in the 300 millibar map, it becomes evident that the wind is changing directions as we travel higher into the sky. This change in wind direction is called wind shear, and it allows for long-lived, self-sustaining thunderstorms, which are also called supercell thunderstorms. Strong wind shear can aid in the development of tornadoes, and it was certainly present during the April 27th tornado outbreak.
The surface weather map also shows that much of the southeast experienced warm air temperatures and high dew point temperatures. The dew point temperature is the temperature at which water vapor (which is a gas) is cooled until it condenses into liquid water; higher dew points allow for clouds to develop quickly, and it also aids in the production of tornadoes.
These ingredients, coupled with other meteorological factors, came together on April 27th to produce one of the most destructive severe weather outbreaks in history. One year later, communities are still recovering and rebuilding from the historical storms, and they are taking the lessons learned to improve for the next natural disaster. For more information about individual tornadoes that hit Georgia, be sure to check out the National Weather Service's full recap of the April 27th and 28th event. Can't get enough of the scientific data behind this storm event? The Storm Prediction Center has this information and more at their Severe Weather Event Archive. Finally, be sure to prepare yourself for the next major weather event by checking out http://www.ready.gov/.
Be sure to read GPB's Heather Neal interview with second grade teacher, Courtney Couey, who experienced the tornado first hand. The interview can be found here.
A weather briefing of the April 27, 2011 severe weather outbreak from the Storm Prediction Center. The meteorologists at the SPC explain the conditions present that will eventually produce one of the most active severe weather events in history. Video courtesy of the Storm Prediction Center.
This is a basic 16:9 Chromeless player that has all of the extra brigtcove options stripped out.
GPB Sports visits Ringgold, Georgia, where two rival high schools put aside their differences to rebuild their town.
Storm Chaser and Filmmaker Sean Casey describes his pursuit of tornadoes.
On the anniversary of
Secondary Content
Author

Bottom Content