Section Branding
Header Content
Using Infographics In The Classroom
Primary Content

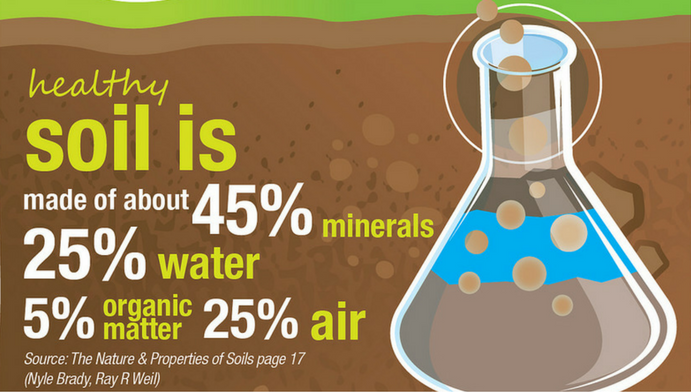
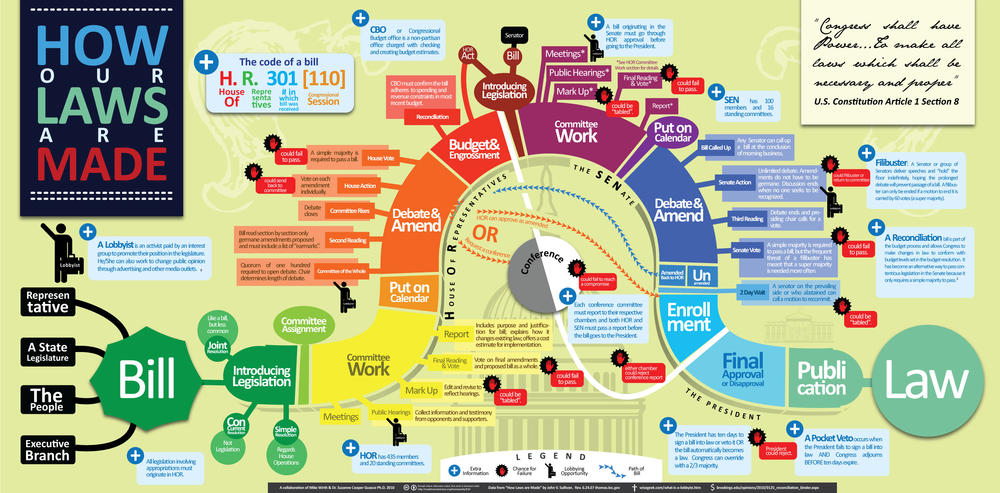
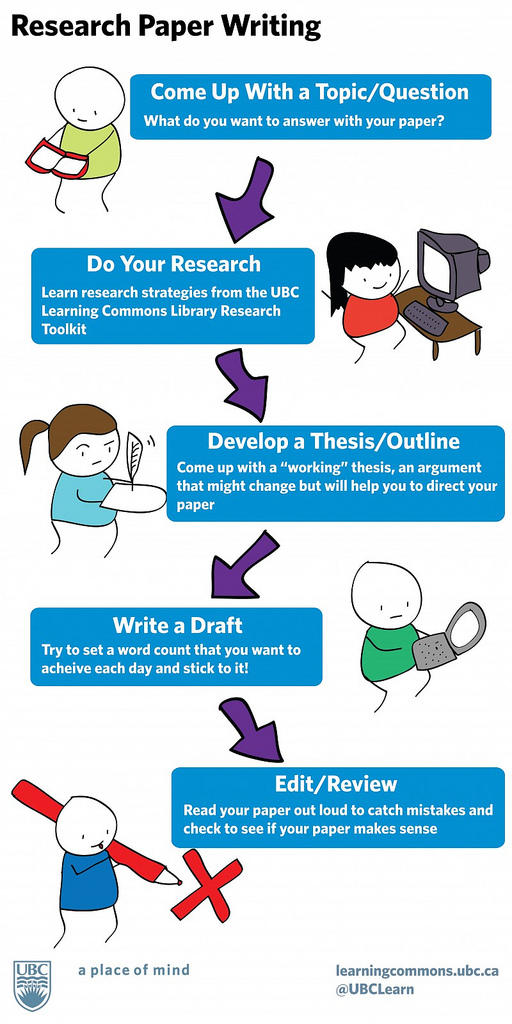
Infographics are visual representations of information or data that have been compiled to explain specific topics. They are an excellent way to display complex information, are easy to make, and can also keep students engaged. Check out these five ways you can use infographics in the classroom.
1. Visual Aids
Although it should be limited, direct instruction is still a way to convey information to students, but it doesn’t necessarily mean that you have to sit in front of your class and lecture. Using an infographic is an innovative way to present new concepts to students and begin meaningful discussions about the material, once they have had time to digest and analyze the details.

2. Classroom Management
Limit the amount of time you have to deal with undesirable classroom behaviors and time-consuming procedures by creating infographics that provide step-by-step instructions about dealing with issues in the classroom. Routines such as what to do when absent, how to submit work on Google Drive, or any other circumstances that frequently arise can be handled independently by students with the use of an instructional infographic. Instead of having to ask you, they can simply look at the graphic and determine what steps to take to address their area of concern.

3. Formative and Summative Assessments
Having students generate infographics is an innovative way for them to demonstrate mastery of a concept. This task breaks away from the traditional essay, report, and PowerPoint method of presentation and also requires more skill. By requiring them to make infographics, students must employ organizational, technological, creative, and analytical skills. Not only do they have to fully understand the information in order to present it correctly, they have to consider their audience and ensure the graphic conveys their research clearly and concisely. One easy-to-use tool that students can make infographics with is Piktochart.
4. Interpreting Data
Using infographics in the classroom frequently helps students become acclimated to looking at and interpreting data, charts, and graphs that always tend to show up on standardized tests. There are multiple ways for them to practice analyzing information, and the New York Times offers many suggestions. One of the most interesting suggestions is to ask students to find two or more graphics that present data about the same groups and determine whether they confirm, explain, or contradict one another. For more great ideas, take a look at their blog on teaching with infographics.
5. Inquiry-Based Learning
Inquiry-based learning is all about allowing students to learn through investigation. Teachers can accomplish this task in a variety of methods such as asking questions, posing problems, and providing factual scenarios about specific topics or issues. Why not present problems to your students using an infographic? Not only do they have to use their interpretive and analytical skills, they have to determine causes and offer solutions.
Do you have any other thoughts and ideas about how to use infographics with your students? Let us know by leaving a comment below or contacting us on Twitter.


